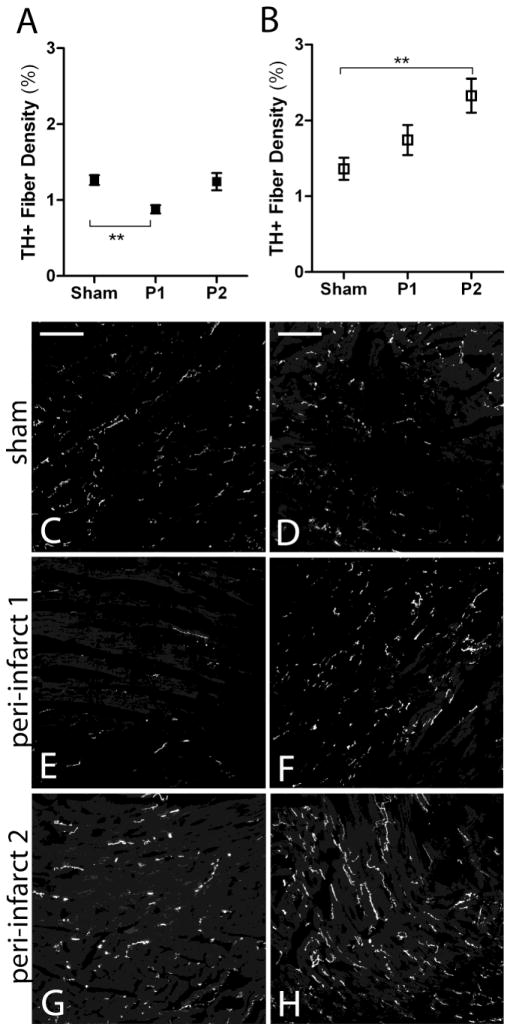
Figure 3.
Sympathetic innervation density 24 hours after ischemia-reperfusion in WT and p75NTR−/− peri-infarct left ventricle. A) Quantification of sympathetic fiber density in the proximal peri-infarct region (P1) and distal peri-infarct region (P2) 24 hours after ischemia-reperfusion from WT (black squares) and B) p75NTR−/− mice (open squares), mean ± SEM, *p< 0.05, n=4–8. C) Representative picture from WT sham operated left ventricle D) and from p75NTR−/− left ventricle. E) Representative picture from the proximal peri-infarct region (peri-infarct 1, P1) from WT mice and F) from p75NTR−/− mice. G) Representative picture from the distal peri-infarct region (peri-infarct 2, P2) from WT mice and H) p75NTR−/− mice. Scale bars= 100μm

