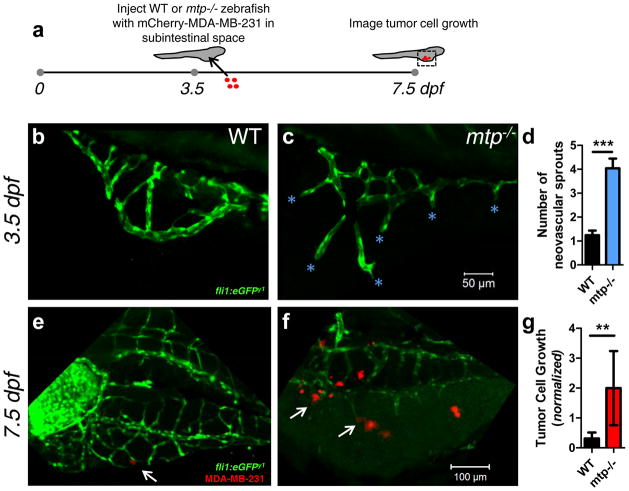
Figure 6.
Ectopic vascular sprouting promotes growth of injected breast tumor cells in zebrafish larvae. (a) ~1–10 mCherry-MDA-MB-231 BCCs were injected into the subintestinal space of 3.5 dpf mtp−/− mutant zebrafish and WT siblings (both containing the fli1:eGFP transgene) and imaged 4 days later. The injection time point (3.5 dpf) was chosen because (b) WT subintestinal vessels had few sprouts by this time point, while (c) the ectopic sprouting phenotype of the mtp−/− mutant was exaggerated (cyan asterisks denote neovascular sprouts). Scale bar = 50 μm. (d) Quantification of ectopic/neovascular sprouts in subintestinal space of WT and mtp−/− mutant siblings (n=25 WT zebrafish analyzed; n=23 mtp−/− zebrafish analyzed). Error bars denote s.e.m. ***p<0.0001 by two-tailed unpaired t-test. Representative images of (e) WT and (f) mtp−/− mutant zebrafish 4 days post-injection (i.e., 7.5 dpf) with mCherry-MDA-MB-231 cells. Scale bar = 100 μm. White arrow in (e) points to small cluster on abluminal surface of subintestinal vessel of WT, while white arrows in (f) point to larger clusters localized to neovascular tips in mtp−/− mutant. (g) Tumor cell area fraction in the subintestinal space was quantified at 7.5 dpf and normalized to the corresponding value post-injection for each surviving zebrafish with viable tumor cells in its subintestinal space to account for any variations in injection density (n=16 WT zebrafish analyzed; n=9 mtp−/− zebrafish analyzed). Error bars denote s.e.m. **p=0.005 by Mann-Whitney test.

