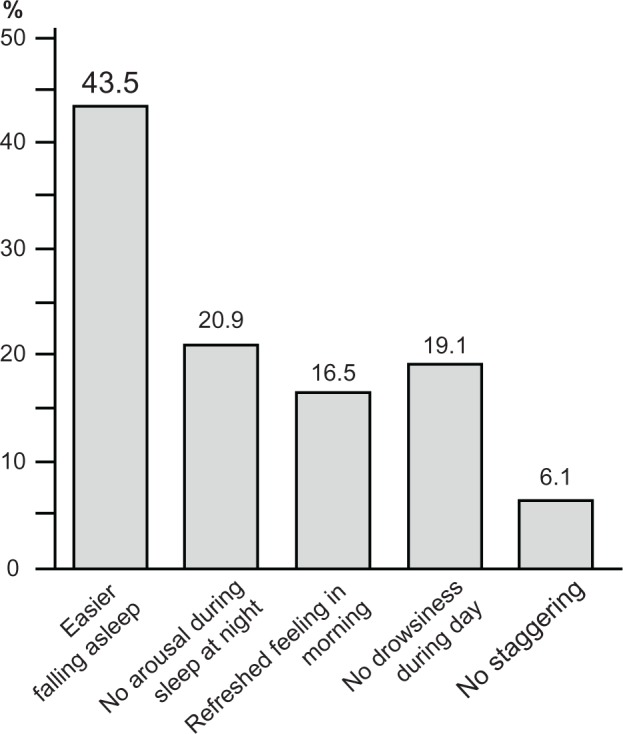
Figure 3.

The percentage of patients showing improvement for each category.
Note: Values were expressed as mean ± SD (n = 115), Wilcoxon test.
Abbreviation: SD, standard deviation.

The percentage of patients showing improvement for each category.
Note: Values were expressed as mean ± SD (n = 115), Wilcoxon test.
Abbreviation: SD, standard deviation.