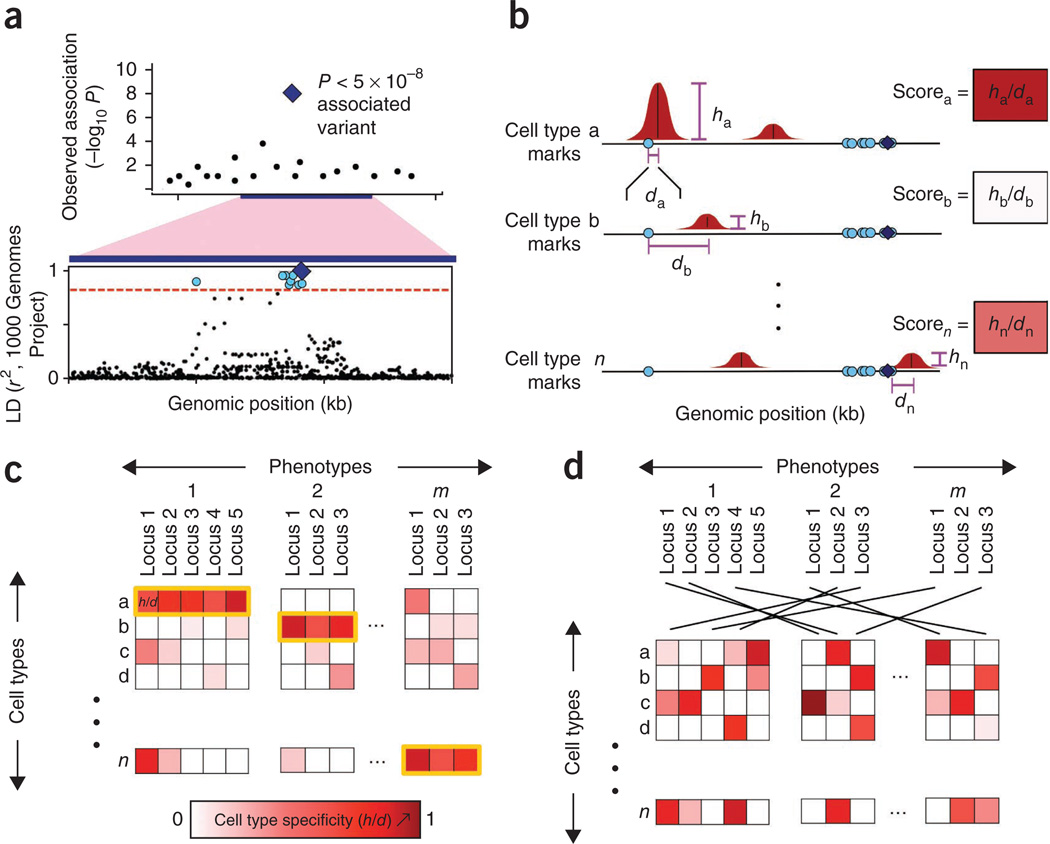
Figure 1.
Overview of the statistical approach. (a) For phenotypically associated variants, other variants in tight LD are found. For each SNP associated with a phenotype from genetic studies (lead SNP, blue diamond; top), we define a locus by identifying SNPs in tight LD (r2 > 0.8, dashed red line; bottom) using data from the 1000 Genomes Project (blue dots; bottom). (b) Each locus is scored on the height and distance of the nearest peak to a variant in LD. For a selected chromatin mark, we define peaks (red) in n cell types across the genome. For each SNP in the locus (blue diamond and light-blue circles), we compute a score equal to the height of the closest peak (vertical purple line) divided by the distance to the summit in each of the n cell types (horizontal purple line). In each locus within each cell type, we note the value of the SNP with the highest score: this measure reflects the overlap between a locus and a cell type–specific regulatory element. (c) Across many phenotypes, we assess whether marks overlap alleles in specific cell types. Here, the measure of cell type specificity of each risk locus is represented by the intensity of red color. A phenotypically cell type–specific mark should consistently give signal in one or a small number of cell types for a given phenotype (yellow outline). We quantify the phenotypic cell type specificity of each mark. (d) Permutations are performed to assess the significance of phenotypic cell type specificity. To compute the significance of the phenotypic cell type specificity for a chromatin mark, we permutate SNPs from different loci across phenotypes; this preserves tissue-specific signals without altering the correlation and prevalence of tissue-specific signals.

