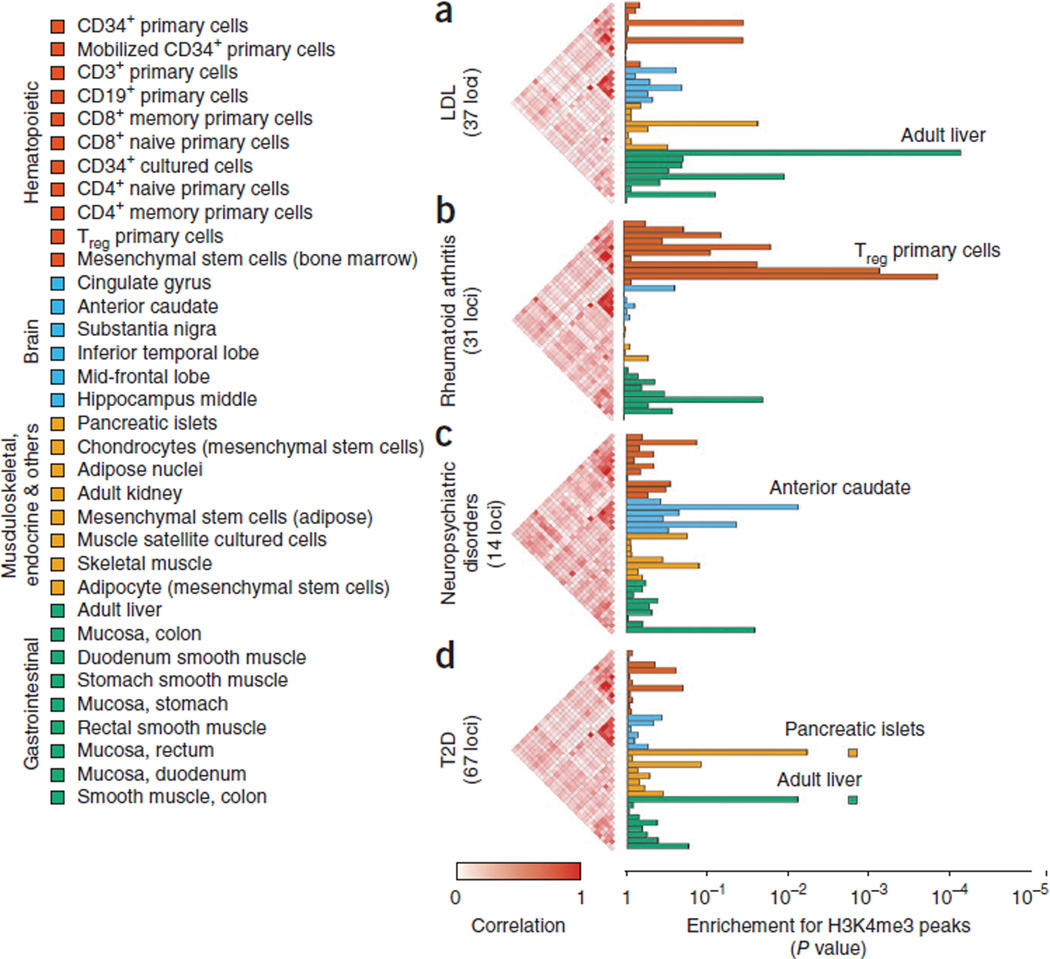
Figure 3.
SNPs for four complex traits overlap H3K4me3 marks in specific cell types. (a–d) We considered four phenotypes: LDL cholesterol plasma concentration (a), rheumatoid arthritis (b), neuropsychiatric disorders (schizophrenia and bipolar disease) (c) and T2D (d). For each phenotype, we calculated the cell type–specific overlap with H3K4me3 histone modification peaks in 34 tissues (listed on the left). The histograms on the right show the significance of the overlap for each tissue with variants from each of the phenotypes, estimated by sampling sets of SNPs matched so that the total number of peaks overlapping SNPs in LD was the same as in the test set. Adjacent to each histogram, we present correlation coefficients between two tissues based on scores computed from randomly sampled sets of independent loci. Colored boxes in d show independent P values for pancreatic islets and liver computed by removing the SNPs scoring highly in one tissue but not the other.

