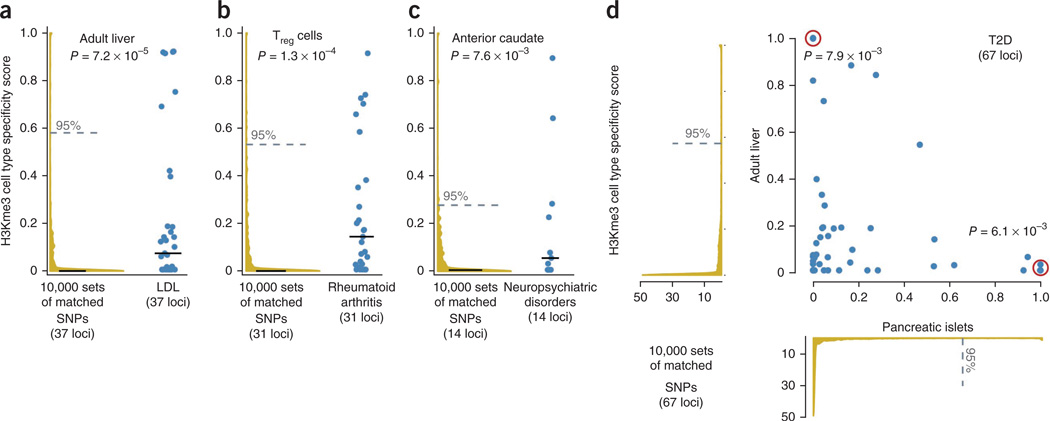
Figure 4.
Cell type specificity for four sets of SNPs. (a–d) The distribution of cell type– specificity scores (h/d; Fig. 1b) is shown for SNPs associated with LDL cholesterol concentration, rheumatoid arthritis, neuropsychiatric disorders and T2D within liver (a), CD4+ Treg cells (b), anterior caudate nucleus (c) and jointly in pancreatic islets (x axis) and liver (y axis) (d). Blue points represent cell type specificity scores. Red circles indicate overlapping points, representing SNPs with very similar scores. We compare these scores to specificity scores in the same tissue of 10,000 sampled sets of matched SNPs from HapMap (yellow density plots). We plot the median specificity for both the distribution of observed SNPs and the sampled sets of matched SNPs (solid lines). Also, we present the 95th-percentile threshold for the sampled sets of matched SNPs (dashed line), which we use as a specificity cutoff. For each phenotype, about one-fourth of variants overlap cell type–specific H3K4me3 peaks.

