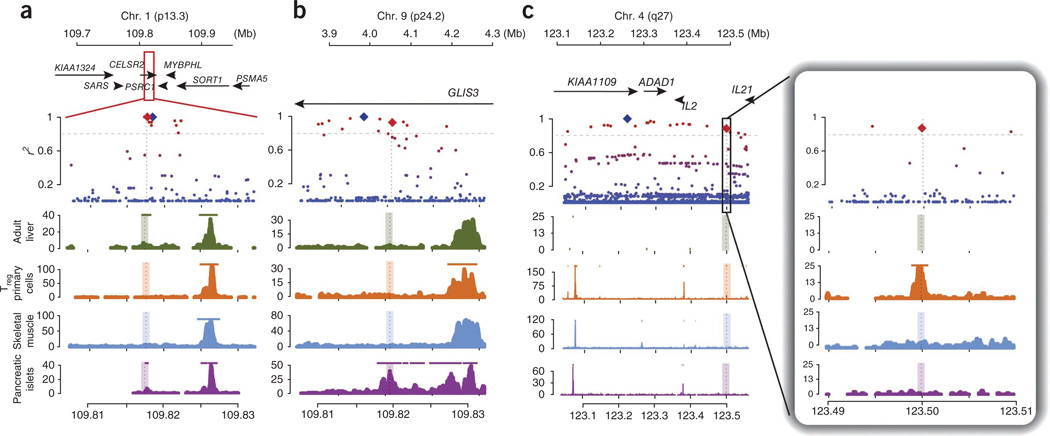
Figure 5.
Selected phenotypically associated loci with high cell type specificity. We present three examples of loci with cell type–specific overlap with H3K4me3 peaks. Top, genomic coordinates and genes near the associated SNP. Middle, lead SNP (blue diamond) and other nearby SNPs from the 1000 Genomes Project (red dots correspond to those with high r2, blue dots correspond to those with low r2). We also show the SNP that is closest to the cell type–specific peak (red diamond). Bottom, H3K4me3 sequence tag counts for selected cell types. Colored horizontal lines in the tissue panels correspond to peak calls. Dashed vertical lines mark the summits of phenotypically cell type–specific peaks. (a–c) Shown are the SORT1 locus for LDL (a), the GLIS3 locus for T2D (b) and the IL2–IL21 locus for rheumatoid arthritis (c).

