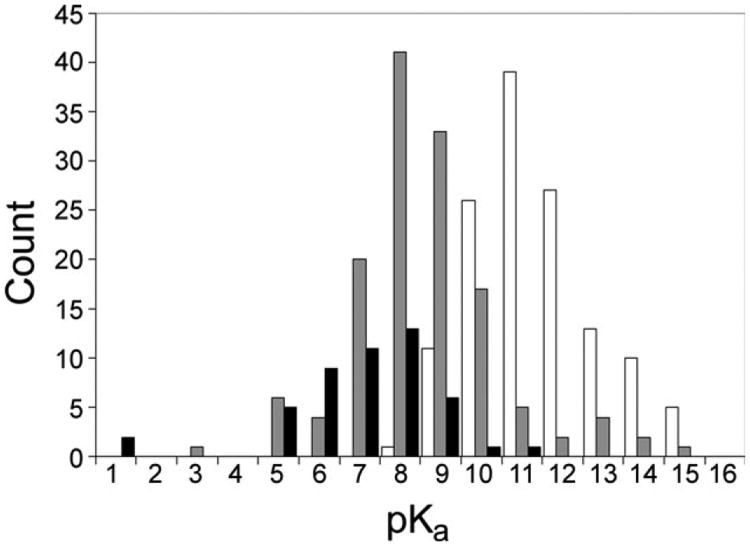
Figure 1.
Distributions of calculated cysteine pKas. The distributions of the calculated cysteine pKas for the control data set with original parameters (white bars), control set with modified parameters (gray bars), and modifiable cysteine pKas (black bars) exhibit means of 10.9, 8.14, and 6.9, respectively. The mean for the control set with modified parameters is consistent with expectations for cysteine pKas, while the mean for the modifiable set is lower, also as expected. The standard deviations are 2.0, 1.9, and 1.4 pH units for the control set with modified parameters, the control set with original parameters, and the modifiable set respectively. Cysteines that lie in the tails of these distributions are discussed in the text.

