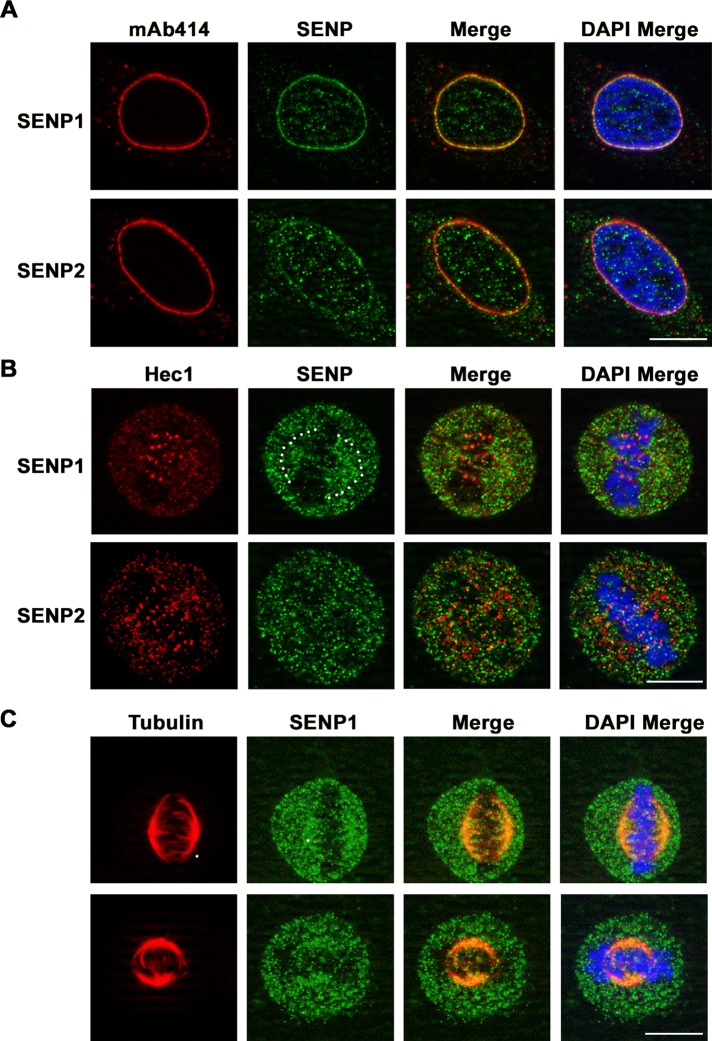
FIGURE 7:
Immunofluorescence microscopy analysis of endogenous SENP1 and SENP2. HeLa cells were fixed, permeabilized, stained, and analyzed by immunofluorescence microscopy. DNA was labeled with DAPI. Cells were colabeled with (A) SENP1- or SENP2-specific antibodies and mAb 414 to detect nuclear pore complexes in interphase, (B) SENP1- or SENP2-specific antibodies and Hec1-specific antibodies in mitosis, and (C) SENP1- and tubulin-specific antibodies in mitosis. Bar, 10 μm.

