FIGURE 8:
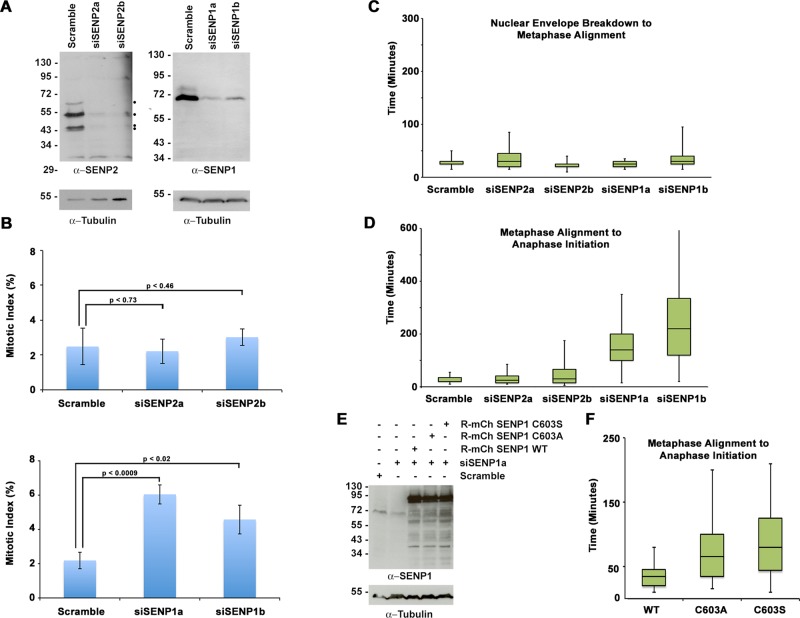
Analysis of endogenous SENP1 and SENP2 by siRNA knockdown. (A) HeLa cells were transfected with a control scramble siRNA, two independent SENP2-specific siRNAs, or two independent SENP1-specific siRNAs. Cell lysates were analyzed by immunoblot analysis with SENP1- or SENP2-specific antibodies and anti-tubulin antibodies as indicated. Dots indicate multiple SENP2 isoforms. (B) HeLa cells were transfected with a control scramble siRNA, two independent SENP2-specific siRNAs, or two independent SENP1-specific siRNAs, and mitotic indices were determined by fluorescence microscopy analysis of DAPI-stained cells 48 h after transfection. Error bars equal the SDs from three independent experiments. (C, D) YFP-H2B–expressing HeLa cells were transfected with control scramble, SENP1, or SENP2 siRNAs and imaged by live-cell fluorescence microscopy starting 48 h after transfection. Time from nuclear envelope breakdown to metaphase alignment and metaphase alignment to anaphase onset was quantified for ≥65 cells from at least three independent experiments for each condition. Outliers, defined as being 1.5× the interquartile range above or below the data set minimum or maximum, are not shown. (E) YFP-H2B–expressing HeLa cells were cotransfected with control scramble or SENP1a siRNA and siRNA-resistant constructs of mCherry-SENP1 WT or the catalytic mutants C603A and C603S. Cells lysates were analyzed by immunoblot analysis with SENP1- or tubulin-specific antibodies. (F) YFP-H2B–expressing HeLa cells were cotransfected with control scramble or SENP1a siRNA and siRNA-resistant constructs of mCherry-SENP1 WT or the catalytic mutants C603A and C603S. Time from metaphase alignment to anaphase onset was measured by live-cell fluorescence microscopy starting 48 h after transfection and quantified for ≥35 transfected cells from three independent experiments for each condition. Outliers, defined as being 1.5× the interquartile range above or below the data set minimum or maximum, are not shown.

