Figure 5.
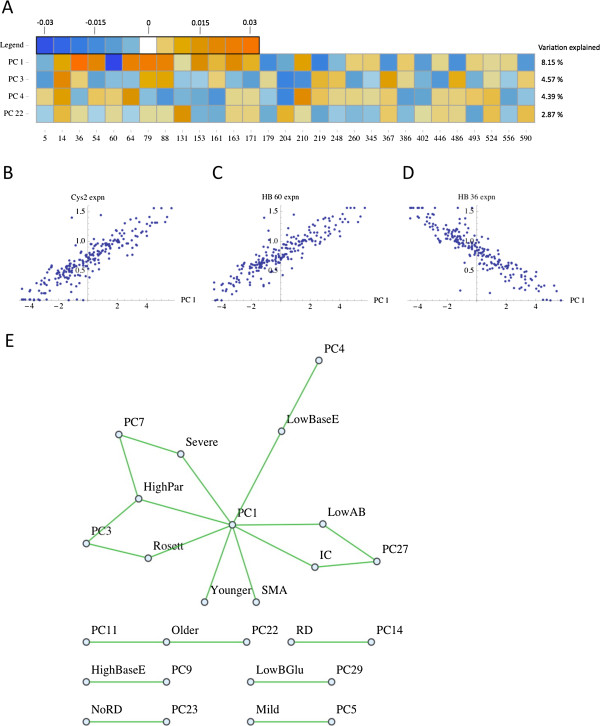
Principal components of HB expression rate profiles. (A) PCs expressed as coordinates in the original space of the data, which is the expression rates for all 29 HBs for each of the isolates. The amount of variation among the isolates that is explained by each of the PCs is shown on the right. (B) The PCA of HB expression rate profiles reflects the differentially expressed HB components, and the first PC defines the extent to which there is a bias toward the expression of var tags with 2 cysteines (cys2). The cys2 expression bias maps roughly to an association with mild versus severe disease spectrum phenotypes. (C) PC1 (and Cys2 var gene expression) correlates with the expression of several HBs, including HB 60. (D) PC1 (and Cys2 var gene expression) anti-correlates with the expression of several HBs, including HB 36. (E) The network of significant correlations between HB expression rate profile principal components (PCs) and disease phenotypes (p ≤ 0.05). SMA = severe malarial anemia, Rosett = rosetting, RD = respiratory distress, Severe = severe disease, Mild = mild disease, Older = high host age, Younger = low host age, Par = parasitemia, BGlu = blood glucose (low levels indicate hypoglycemia), BaseE = base excess (low levels indicate metabolic acidosis), AB = antibody response.

