
Fig. 3.
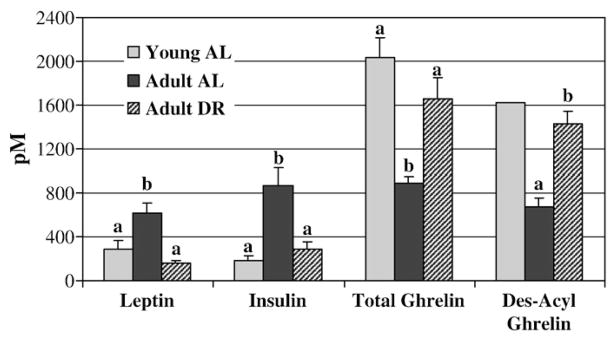
Plasma leptin, insulin, total ghrelin and des-acyl ghrelin concentrations in young and adult ad libitum versus dietary-restricted rats. Results represent the mean±SEM for 8 adult AL (ad libitum), 9 adult DR (dietary restriction), and 6 young AL rats. Blood was sampled in the morning ~2 h into the light cycle. Des-acyl ghrelin concentrations were not measured in the young AL rats due to a limited volume of plasma. The bar in the graph represents an estimated level from the known proportion of total ghrelin concentrations measured in the adult DR and AL rats. Values with different letters are significantly different within a given hormone (p<0.01).