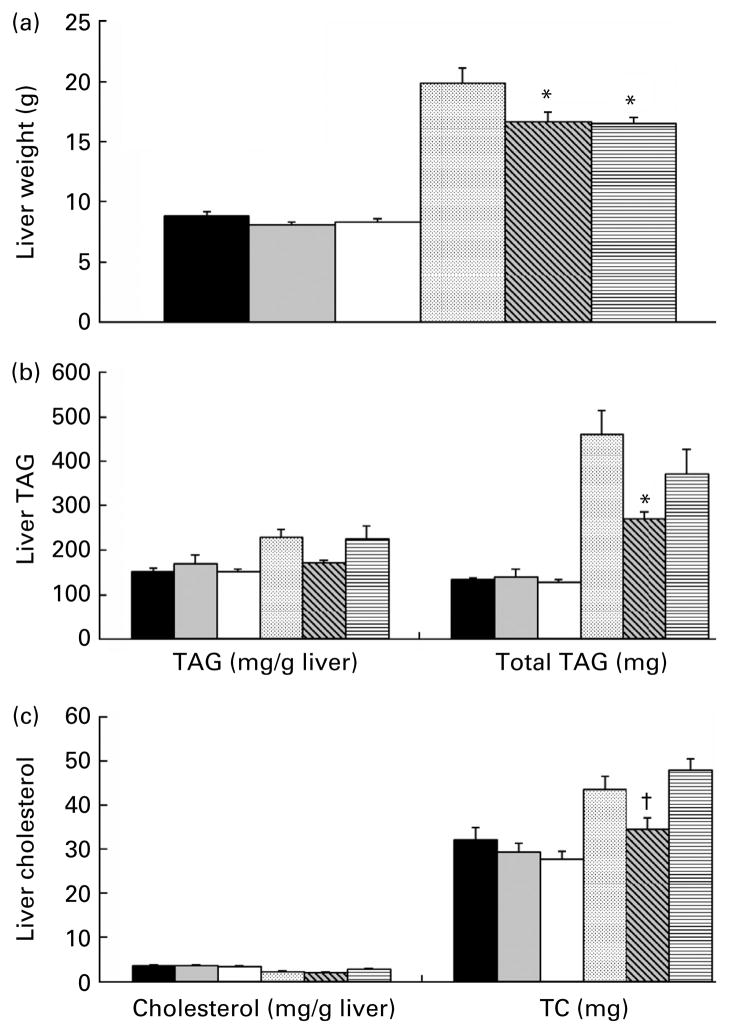
Fig. 1.
Liver characteristics for the lean and obese rats fed control (0 %), fibre (10 %) and high-fibre (20 %) prebiotic diets. Panel (a) depicts total liver weight. Panel (b) depicts liver TAG content. The series on the left shows TAG content per g of wet liver tissue and the series on the right shows total TAG content of the liver. Total TAG content was calculated by multiplying TAG/g of tissue by total liver weight. For ease of presentation, total liver TAG content was reduced by a factor of 10. Actual values from left to right are 1343·0, 1393·7, 1276·7, 4626·5, 2701·2 and 3719·2 mg. Panel (c) depicts liver cholesterol content. The series on the left shows cholesterol content per gram of wet liver tissue and the series on the right shows total cholesterol (TC) content of the liver. TC content was calculated by multiplying cholesterol per gram of tissue by total liver weight. Data are mean (SE); n 8 except obese high fibre (OHF) group n 7. * Mean values were significantly different from control diet within lean or obese groups. † Mean values were signifi-cantly different between the 10 % and 20 % fibre diets within lean or obese groups as determined by ANOVA with Holm–Sidak adjustment for multiple comparisons or a one-way ANOVA with Bonferroni adjustment where there was a significant diet and group interaction (P≤0·05). LC (■), lean control; LF (
 ), lean fibre; LHF (□), lean high fibre; OC (
 ), obese control; OF (
 ); obese fibre; OHF (▤), obese high fibre.

