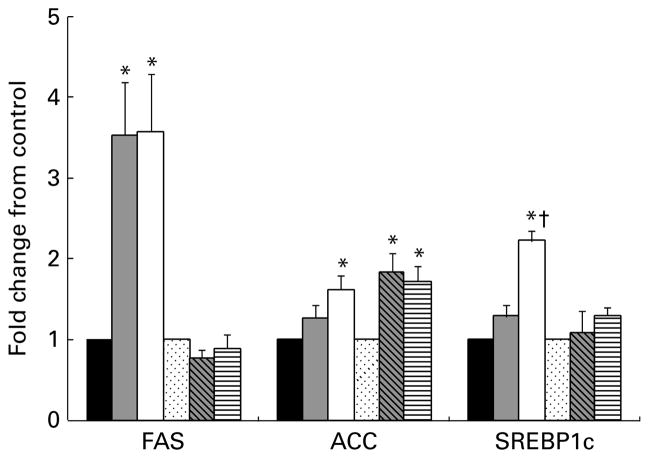
Fig. 3.
Liver mRNA levels of genes primarily associated with fatty acid metabolism for lean and obese rats fed control (0 %), fibre (10 %) and high-fibre (20 %) prebiotic diets. Results represent the mean fold change (SE) compared to control, n 8 except obese high fibre (OHF) group n 7. * Mean values were significantly different from the control diet within lean and obese groups † Mean values were significantly different between the 10 % and 20 % fibre diets within lean and obese groups as determined by one-way ANOVA with Bonferroni adjustment (P≤0·05). LC (■), lean control; LF (
 ), lean fibre; LHF (□), lean high fibre; OC (
 ), obese control; OF (
 ), obese fibre; OHF (▤), obese high fibre; FAS, fatty acid synthase; ACC, acetyl-CoA carboxy-lase-α; SREBP1c, sterol regulatory element-binding protein 1c.

