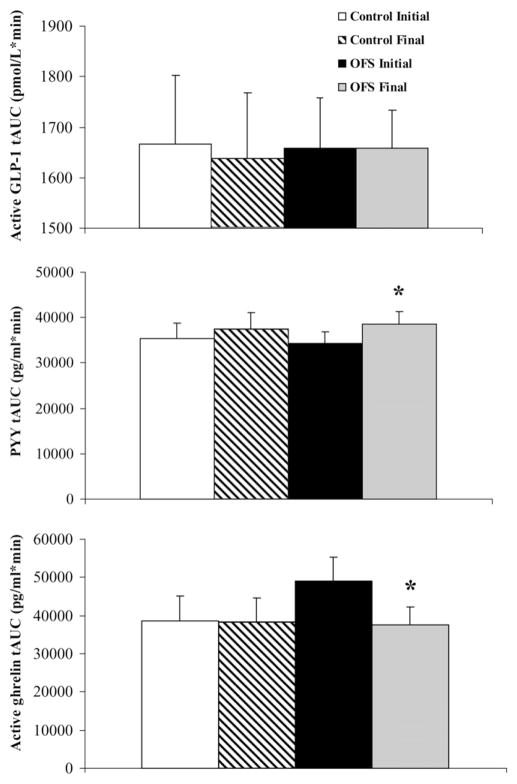
FIGURE 3.
Mean (±SEM) total area under the curve (tAUC) values for plasma active glucagon-like peptide 1 [GLP-1; n = 13 control, n = 18 oligofructose (OFS)], total peptide YY (PYY; n = 14 control, n = 18 OFS), and active ghrelin (n = 15 control, n = 20 OFS) during a 6-h meal tolerance test. Two-factor repeated-measures ANOVA showed a month × diet interaction for PYY (P = 0.007) and ghrelin (P = 0.05). *Significant difference in the OFS group between initial and final tests, P < 0.05.

