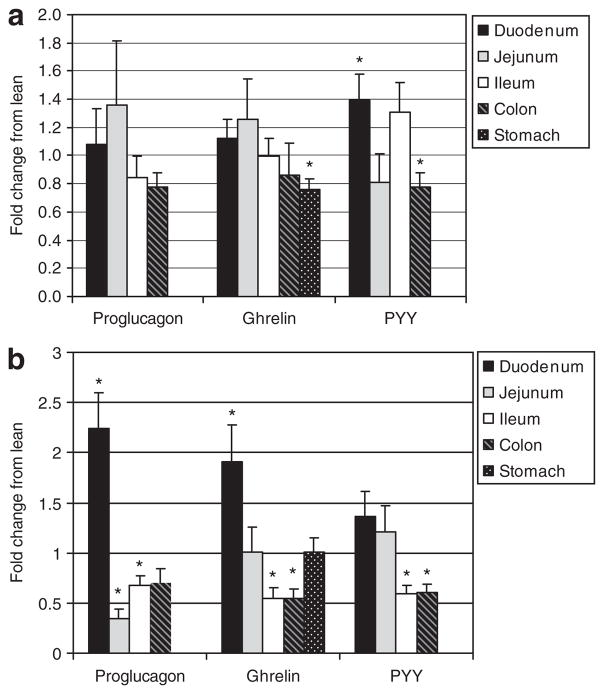
Figure 1.
mRNA level of satiety hormones at the onset and in well-established obesity, as determined by real-time PCR. (a) Young 3.5-week-old rats. (b) Adult 9-month-old rats. Results represent the mean fold change ± s.e.m. compared to lean controls. An ANOVA was done to determine significance. Asterisk represents a significant difference between lean and obese within a specific tissue (P ≤ 0.05). PYY, peptide YY.

