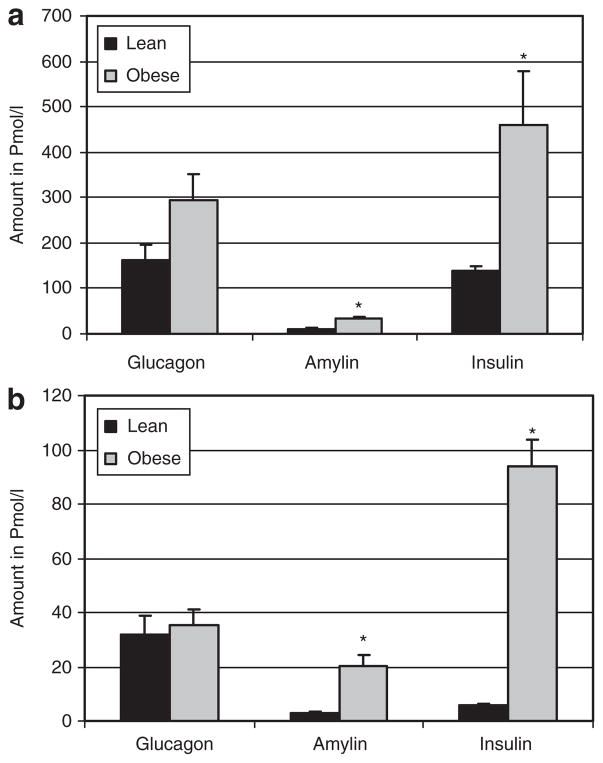
Figure 2.
Plasma glucagon, amylin and insulin for lean and obese rats at the onset and in well-established obesity. (a) Young 3.5-week-old rats. (b) Adult 9-month-old rats. Plasma, obtained via a cardiac bleed, was analyzed using a LINCOplex kit to determine glucagon, total amylin, and insulin. Results represent mean ± s.e.m. Due to the marked hyperinsulinemia of adult rats, actual insulin concentrations in (b) are tenfold higher than represented on the graph for presentation purposes (i.e., lean were 55.9 ± 7.1 and obese were 938.1 ± 99.2). Asterisk represents a significant difference between lean and obese (P ≤ 0.05).

