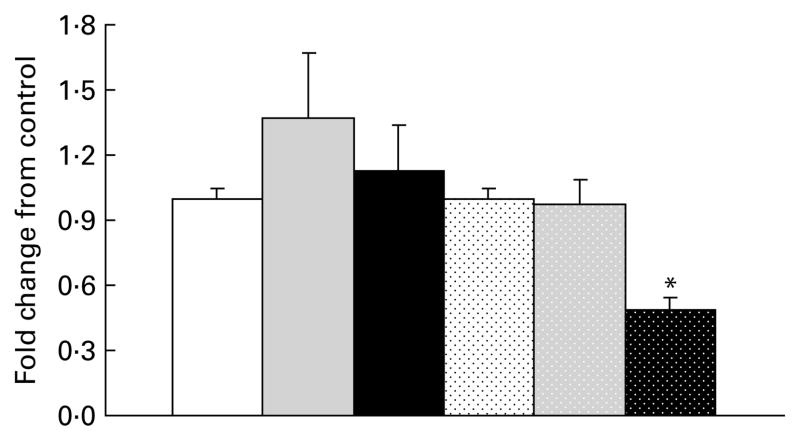
Fig. 4.
Ghrelin O-acyltransferase mRNA levels in lean and obese rats exposed to a control, fibre or high-fibre diet. Values are means, with their standard errors represented by vertical bars (n 8). * Mean values were significantly different from the control diet within the obese groups (P<0·05). LC (□), lean control; LF (
 ), lean fibre; LHF (■), lean high fibre; OC (
 ), obese control; OF (
 ), obese fibre; OHF (
 ), obese high fibre.

