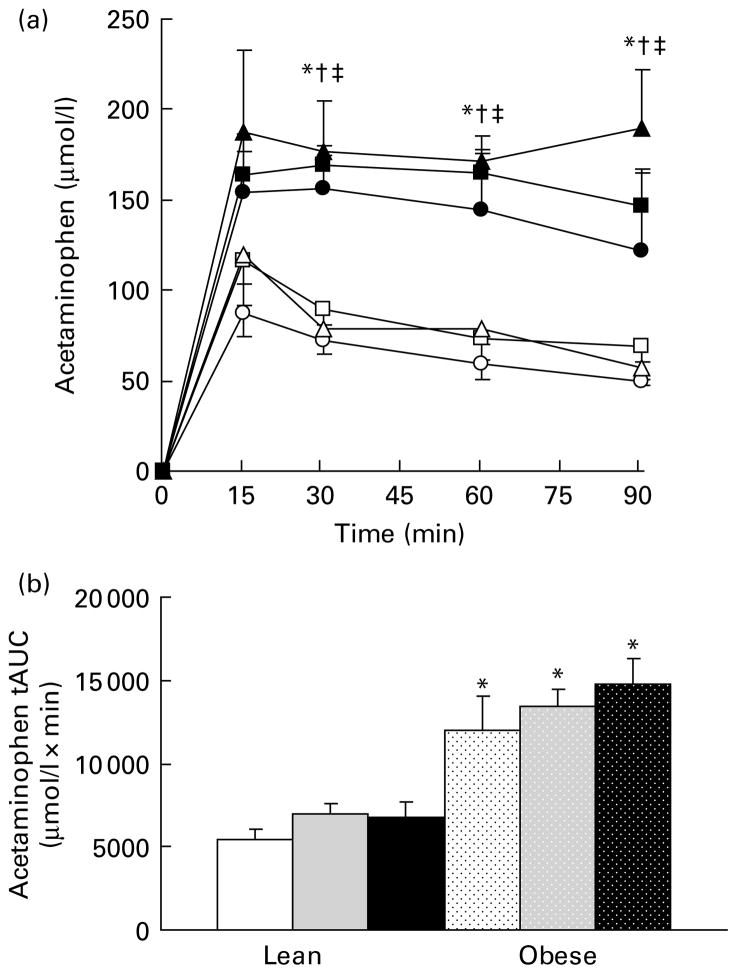
Fig. 6.
Acetaminophen levels during a gastric emptying test. Values are means, with their standard errors represented by vertical bars (n 6). (a) Serial values during the 90 min test. * Mean values were significantly different between the lean and obese groups from those of the control diets (P≤0·05; two-way ANOVA and repeated-measures ANOVA). † Mean values were significantly different between the lean and obese groups from those of the 10 % fibre diets (P≤0·05; two-way ANOVA and repeated-measures ANOVA). ‡ Mean values were significantly different between the lean and obese groups from those of the 20 % fibre diets (P≤0·05; two-way ANOVA and repeated-measures ANOVA). (b) Total area under the curve (tAUC). * Mean values were significantly different between obese and lean within a diet group (P≤0·05; two-way ANOVA and repeated-measures ANOVA). LC ((a) —○—; (b) □), lean control; LF ((a) —□—; (b)
 ), lean fibre; LHF ((a) —△—; (b) ■), lean high fibre; OC ((a) —●—; (b)
 ), obese control; OF ((a) —■—; (b)
 ), obese fibre; OHF ((a) —▲—; (b)
 ), obese high fibre.

