
Figure 7. Detection of GAP-43 and p-AKT expression.
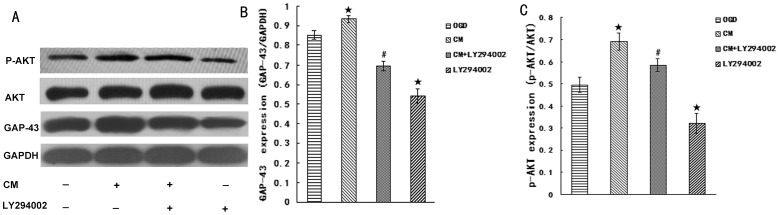
(A) The most representative image of wesrernblot analysis for GAP-43 and p-AKT expression. (B) Statistical graph of GAP-43 expression in different group (n = 6). (C) Statistical graph of p-AKT expression in different group (n = 6). ★P<0.05 vs Control group, #P<0.05 vs CM group.