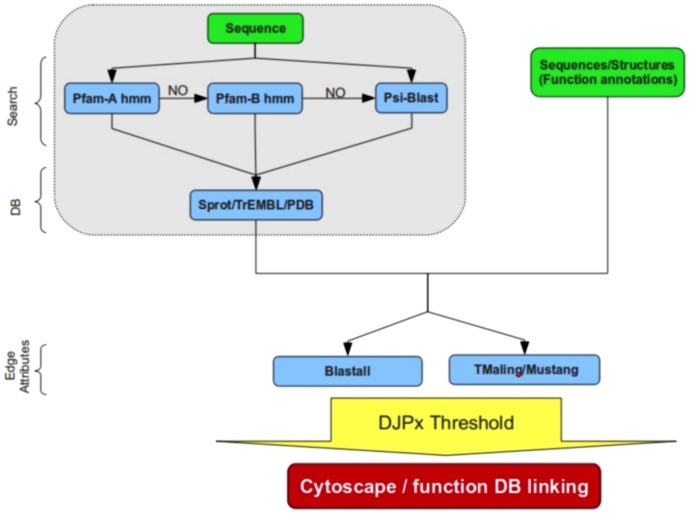
Figure 1. Flow chart of PANADA.
An overview of alternative steps performed by PANADA is shown. Depending on the input, a set of proteins, sequences or structures, or a single sequence may be submitted. In the latter case PANADA uses Pfam and/or BLAST to find homologs. Functional annotations may be provided by the user if a set of sequences or structures is uploaded. In all cases the network is generated for a given similarity threshold and with a maximum number of edges per node (DJPx algorithm). The output can then be used in Cytoscape for visual analysis.

