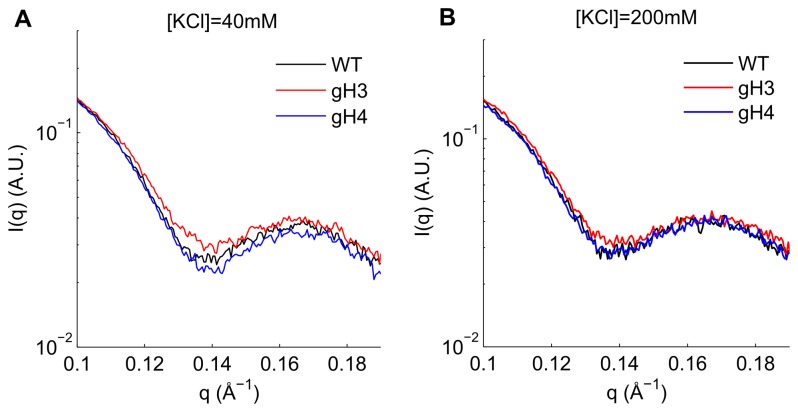
Figure 2. SAXS profiles of all wild-type, gH3, and gH4 nucleosomes at two salt concentrations.
SAXS signals of the wild-type (black), gH3 (red), and gH4 (blue) constructs in 40 mM (A) and 200 mM (B) KCl are shown. The lower minima at q=0.14 Å-1 indicates less DNA unwrapping (see Figure 1). Note that in the 40 mM KCl signal, the signals are arranged in order of increasing DNA unwrapping from gH4 to WT to gH3; however the differences between gH4 and WT are minimal. For the 200 mM KCl SAXS data, the WT and gH4 constructs are indistinguishable at q=0.14 Å-1 within the noise of the SAXS signal, while the gH3 shows significant DNA unwrapping in comparison. These results were independent of signal matching region (Figure S5 in Materials S1).

