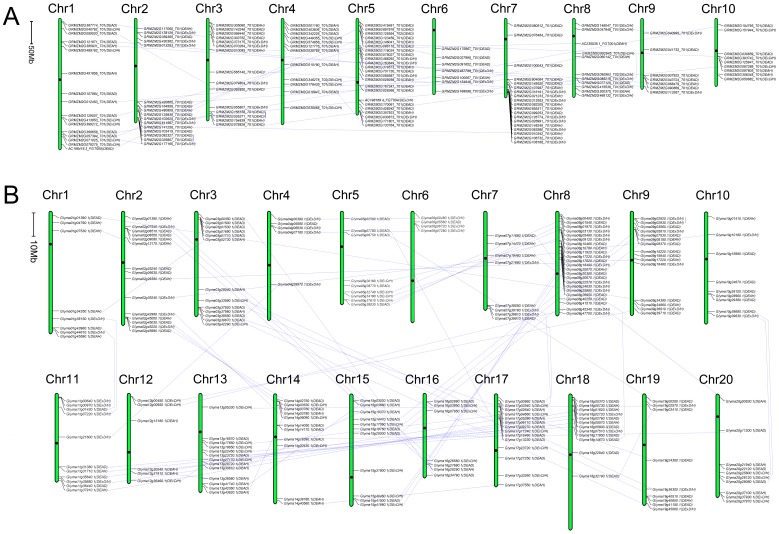
Figure 2. The chromosomal mapping of the RNA helicase gene family.
(A) Zea mays, (B) Glycine max. The scale bar represents a 10.0 Mb chromosomal distance. The chromosome number is indicated at the top of each chromosome. To simplify the presentation, we named the putative RNA helicase genes with their own Gene ID. The subfamily of each RNA helicase gene was shown in parentheses. The paralogous sister pairs of RNA helicase genes were connected by light blue line, which had very strong bootstrap support (>90%). The positions of centromeres were marked with the black dot.

