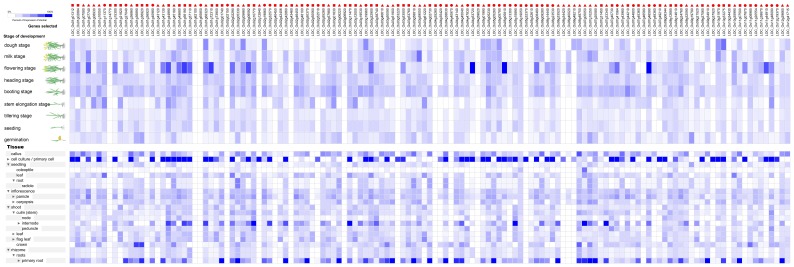
Figure 5. The expression profiles of 138 RNA helicase genes in Oryza sativa.
The expression profiles of 138 RNA helicase genes in different development stages (above) and different tissues (below) in Oryza sativa. The deep and light blue shading represents the relative high or low percent potential expression levels, respectively, of the helicase genes in different development stages and different tissues. The DEAD-box, DEAH-box and DExD/H-box RNA helicase genes are indicated by the red triangle, circle and square, respectively.

