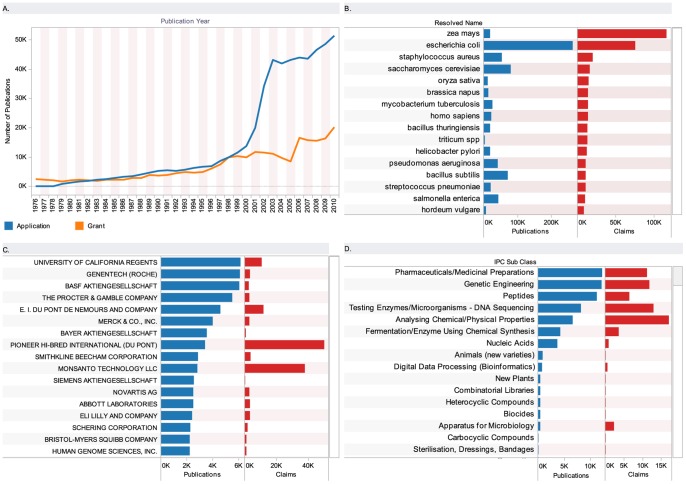
Figure 3. Trends in Patent Activity for Biodiversity.
A. Trends by patent applications and grants based on patent kind codes A (applications) and B (grants) adjusted for US practice. Note that prior to 2001 the United States only published patent documents when granted. This produces a reporting effect in the form of a sharp spike in patent applications in 2001. B. Species appearing in patents including the number of publications (publications) where a species appears and the number of occurrences of a species name in the patent claims (claims). The data is ranked on occurrences of a species in patent claims as a measure of the intensity of activity for the species. Note that data for food crops includes common names (Supporting information S1). C. Patent applicants harmonized using EEE-PPAT 2012 (Supporting information S1). Data does not address mergers and acquisitions. D. Technology area based on International Patent Classification, 8th edition, sub-class codes. Sub-class descriptions have been edited for presentation.

