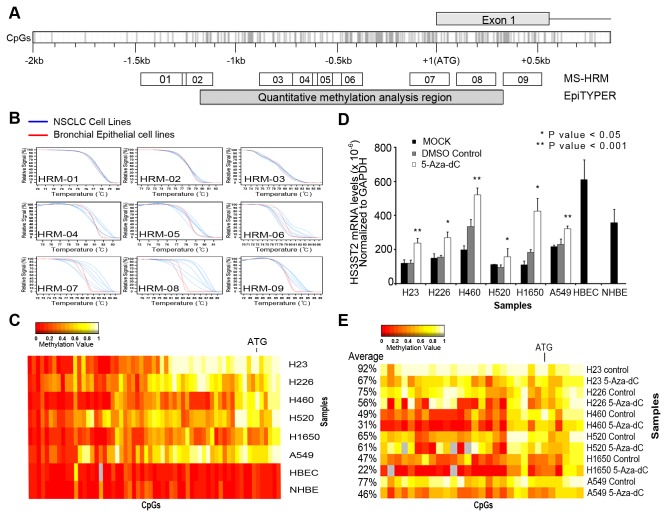
Figure 1. Expression recovery of silenced HS3ST2 gene by 5-Aza-dC.
(A) CpG island map of HS3ST2 promoter and the regions analyzed using MS-HRM and EpiTYPER assay. (B) Methylation status of HS3ST2 was first evaluated in six lung cancer cell lines and two bronchial epithelial cell lines using MS-HRM. (C) Methylation status of individual CpGs at a 1.5 kb promoter region (HRM-04, 05, 06, 07, 08, and 09) was quantitatively analyzed in the cell lines using the EpiTYPERTM assay. Methylation levels are depicted as a color change on a continuous scale from red (0% methylated) to white (100% methylated). (D) Transcript levels of HS3ST2 were compared between highly methylated lung cancer cell lines and bronchial epithelial cell lines by qRT-PCR (black bar). Recovery of HS3ST2 transcription was assessed after treatment of six lung cancer cell lines with 5-Aza-dC for 72 h (gray bar vs. white bar; P-values are based on Wilcoxon signed-rank test). (E) Methylation status of CpGs around the highly methylated ATG area of the HS3ST2 gene was assessed after treatment with 5-Aza-dC for 72 h. The heatmap shows typical patterns of demethylation in cancer cells in response to 5-Aza-dC, and the percentages indicate average methylation levels.

