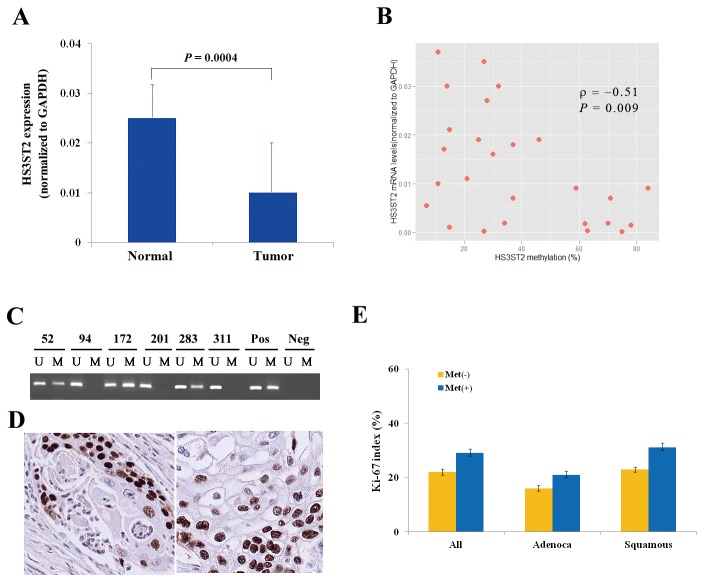
Figure 5. Relationship between HS3ST2 hypermethylation and clinicopathological variables.
(A) HS3ST2 mRNA levels were first compared quantitatively between 26 fresh-frozen tumor tissues and corresponding normal tissues (Wilcoxon signed-rank test, P = 0.0004). Data are presented as the mean 2-ΔC T value of triplicate experiments, and the bars represent standard deviations. (B) Negative correlation between expression and methylation levels of HS3ST2 was observed using Spearman’s rank correlation analysis in 26 tumor tissues (ρ = -0.51, P = 0.009). (C) Methylation of the HS3ST2 promoter was analyzed in paraffin-embedded tissues from NSCLC patients using methylation-specific PCR (MSP). Patient identification numbers are indicated. “M” and “U” represent amplification of the methylated and unmethylated allele, respectively. “Pos” represents the positive controls for the methylated and unmethylated alleles. Negative control samples without DNA were included for each PCR. (D) Expression of Ki-67 was analyzed by immunohistochemical analysis. Figures show representative examples of positive expression of Ki-67 in adenocarcinoma (left) and squamous cell carcinoma (right) (Magnification: ×200). (E) Association of HS3ST2 hypermethylation with Ki-67 proliferation index was evaluated in 298 NSCLCs. Error bars represent standard error. “Adenoca” and “Squamous” indicate adenocarcinoma and squamous cell carcinoma, respectively. “Met (+)” and “Met (-)” represent the presence and absence of HS3ST2 hypermethylation, respectively.

