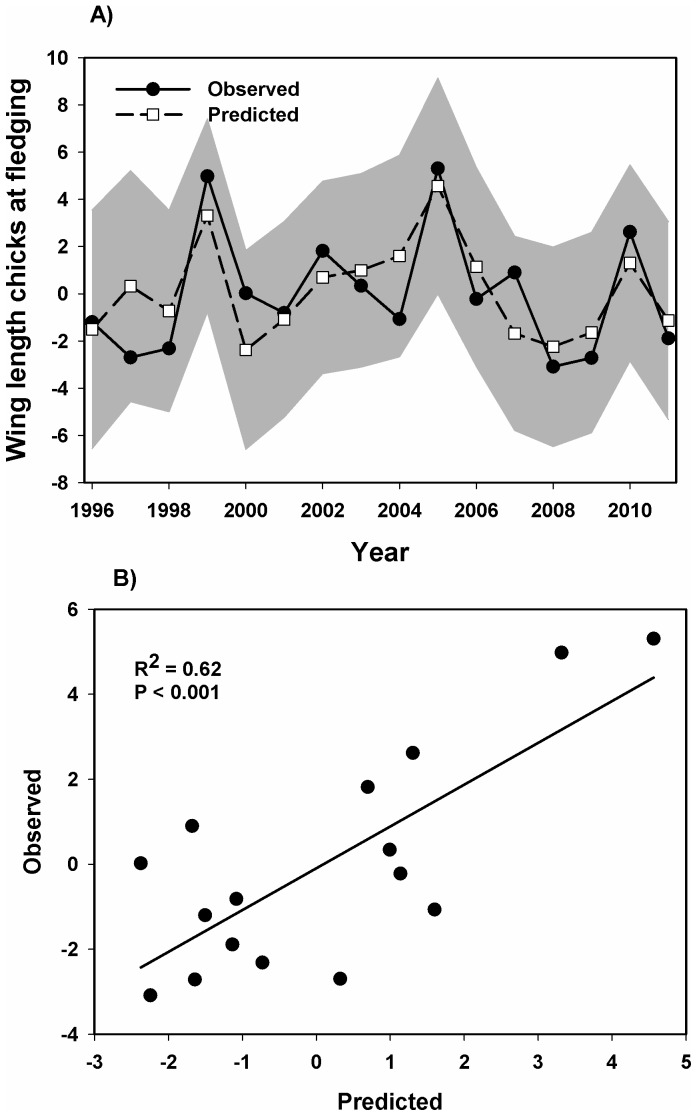
Figure 5. Annual variation in common guillemot chick body size.
A) Annual variation in common guillemot chick body size at fledging and the fitted values from the autoregressive model between chick body size and the density of cod larvae from southern nursery grounds accumulating around Hornøya (with 95% confidence limits, shaded area) (Table 1, Tab. S1). B) The same data as in (A), with predicted values plotted against observed values.

