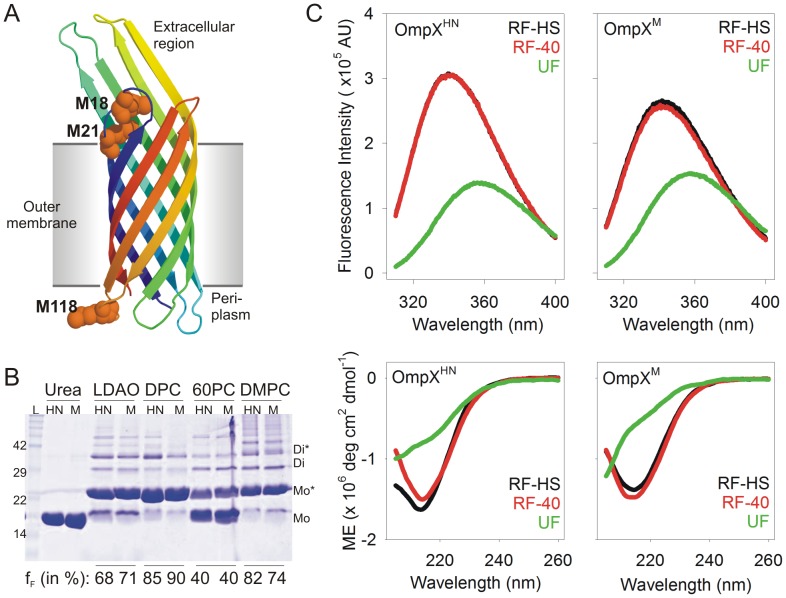
Figure 1. OmpXHN and OmpXM show comparable refolding efficiency.
(A) Cartoon representation of OmpXHN (PDB ID: 1QJ8) generated using PyMol [62], with the three Met residues at positions 18, 21 and 118, rendered as spheres. These methionines have been mutated to leucine in OmpXM. (B) SDS-PAGE analysis of unboiled samples, comparing the refolding efficiency of OmpXHN (labeled HN) and OmpXM (labeled M). Refolding of these samples was achieved by the slow folding method at 40°C, in lipids and detergents mentioned above each lane. Upon folding, OmpX migrates at ∼22 kDa, compared to the unfolded protein (labeled urea) at ∼16 kDa. Fraction folded (fF), determined by densitometry using band intensity of the monomeric species, is indicated below each lane. Samples were not centrifuged to remove any precipitated protein, so that a correct estimate of the folding efficiency in each condition could be obtained. Note the formation of higher order oligomers for both proteins, upon refolding, as observed earlier for OmpA [63]. LDAO: lauryldimethylamine oxide; DPC: n-dodecylphosphocholine; 60PC: 6∶0 diether PC; DMPC: 1,2 dimyristoyl-sn-glycero-3-phosphocholine; L: protein MW marker; Mo: unfolded monomer; Mo*: folded monomer; Di: unfolded dimer; Di*: folded dimer. (C) Fluorescence emission (top panels) and far-UV CD spectra (bottom panels) of OmpXHN (left) and OmpXM (right), refolded using heat shock (RF-HS) and slow folding at 40°C (RF-40). Spectra of unfolded protein samples (UF) in 8 M GdmHCl or directly re-suspended in buffer, for fluorescence and CD scans, respectively, are also provided for comparison. The labels reflect color codes used for the respective samples. Note that in the top left panel, the fluorescence emission spectrum of RF-HS OmpXHN (black curve) is directly underneath the spectrum of RF-40 OmpXHN (red curve).

