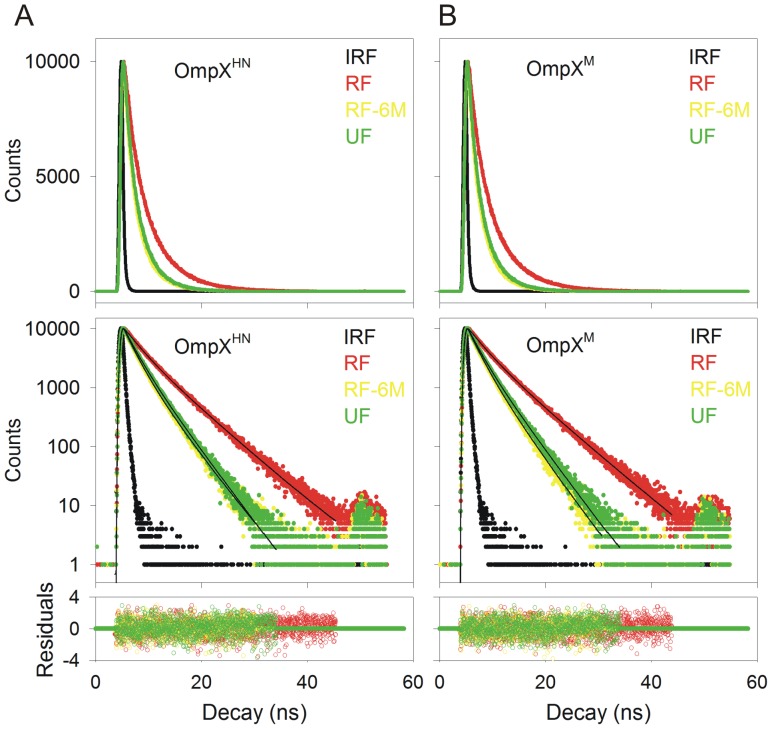
Figure 2. Fluorescence lifetime measurements to assess the local tryptophan environment.
The upper panels show representative fluorescence decay profiles of the heat shock refolded protein (RF) for OmpXHN (A) and OmpXM (B). The refolded samples were unfolded by incubation in 6 M GdmHCl for 24 h, and the lifetime measurements so obtained are marked as RF-6M. Protein powder, directly dissolved in 8 M GdmHCl and containing no lipid or detergent, was used as control (UF). IRF refers to instrument response function, which was determined using skimmed milk. The middle panels show fits of the decay profiles to a three exponential function. Residuals obtained from the fit are in the bottom panel. Labels are color coded to match their respective spectra.

