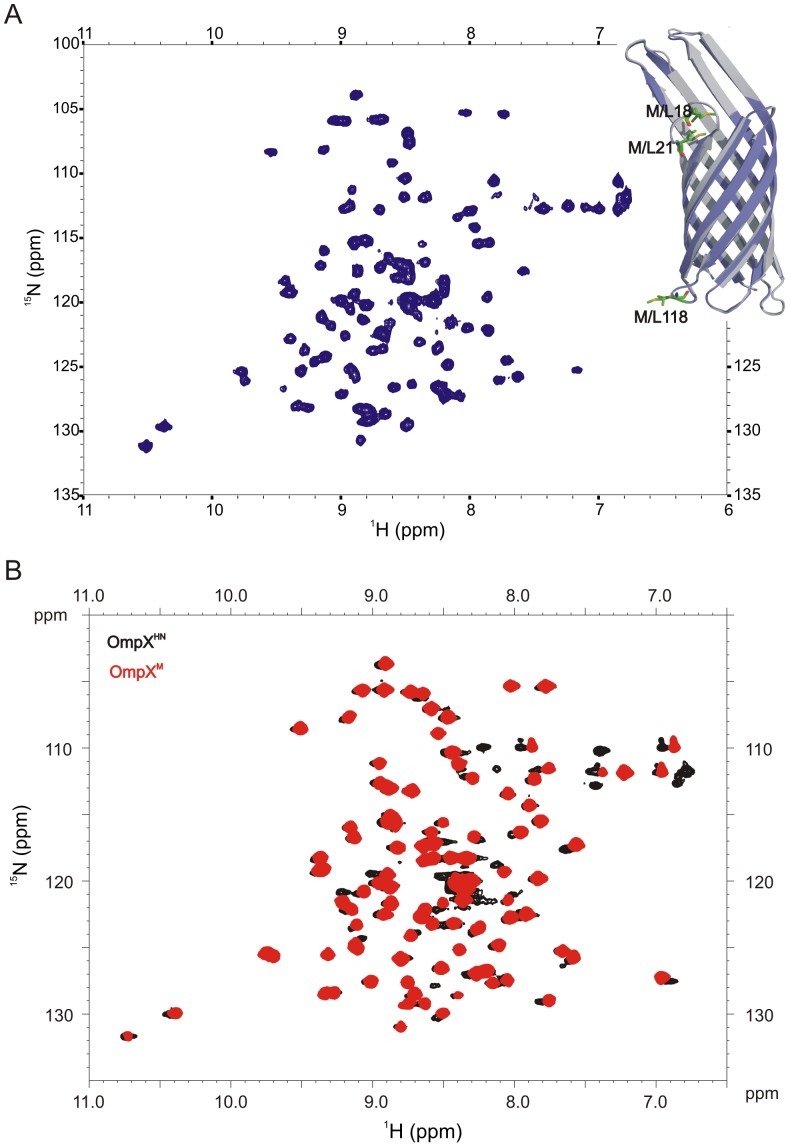
Figure 3. 1H-15N HSQC spectra of uniformly 15N labeled OmpXM.
(A) Spectrum of OmpXM refolded in 150 mM 60PC acquired on a 500 MHz spectrometer using conditions reported earlier [19]. Inset illustrates the ribbon diagrams of OmpXHN (grey) and OmpXM (slate) with the methionines of OmpXHN and the corresponding leucines of OmpXM highlighted. The OmpXM structure was generated by homology modeling using I-TASSER [64], with Met residues at positions18, 21, 118 replaced by Leu residues, and 1QJ8 [18] as the starting template. (B) Overlay of the 1H-15N HSQC spectra of OmpXHN (black) and OmpXM (red), highlighting similar resonance distribution between both the proteins. The OmpXHN spectrum is adapted from [14].

