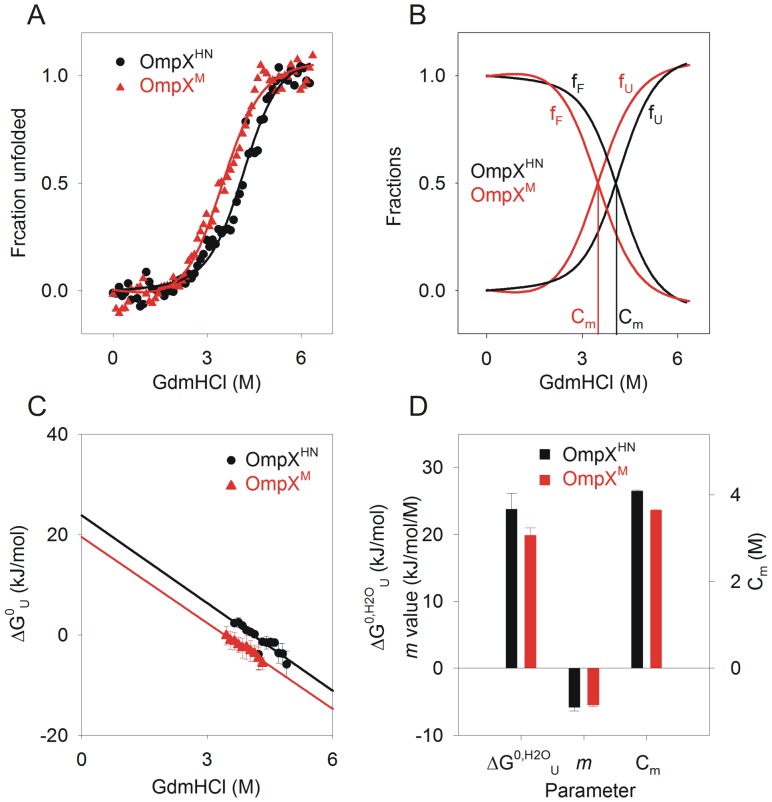
Figure 5. GdmHCl-induced equilibrium unfolding of OmpXHN and OmpXM refolded by the slow folding method.
(A) GdmHCl-induced denaturation was monitored using Trp fluorescence, and the unfolding transitions of OmpXHN (black circles) and OmpXM (red triangles) were fit to a two-state equation to obtain Cm. Error bars are omitted for purposes of clarity. The fits are shown as solid lines. (B) Folded (fF) and unfolded (fU) fractions, plotted against GdmHCl, indicate a Cm of ∼4.0 M and ∼3.6 M for OmpXHN (black) and OmpXM (red), respectively. Unfolding free energy (C) at various GdmHCl concentrations were linearly extrapolated to obtain ΔG0,H2O U in water. Thermodynamic parameters (ΔG0,H2O U in water, m value and Cm) derived from the equilibrium unfolding experiments are plotted in (D).

