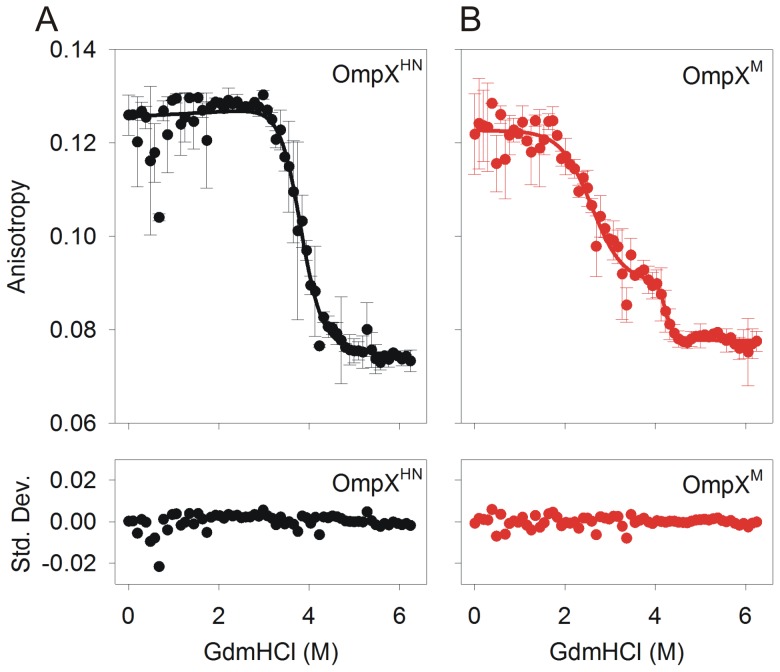
Figure 6. Steady state Trp fluorescence anisotropy measurements.
OmpXHN (A) and OmpXM (B) refolded using heat shock in 10 mM LDAO were subjected to GdmHCl denaturation for 24 h and anisotropy values were recorded. Fits to a two-state equation for OmpXHN and a three-state equation for OmpXM, are shown as solid lines. Note that the unfolding of OmpXM follows a three state transition, while OmpXHN fits well to a two-state, as indicated by the residuals (shown below each curve as standard deviation (Std. Dev.)).

