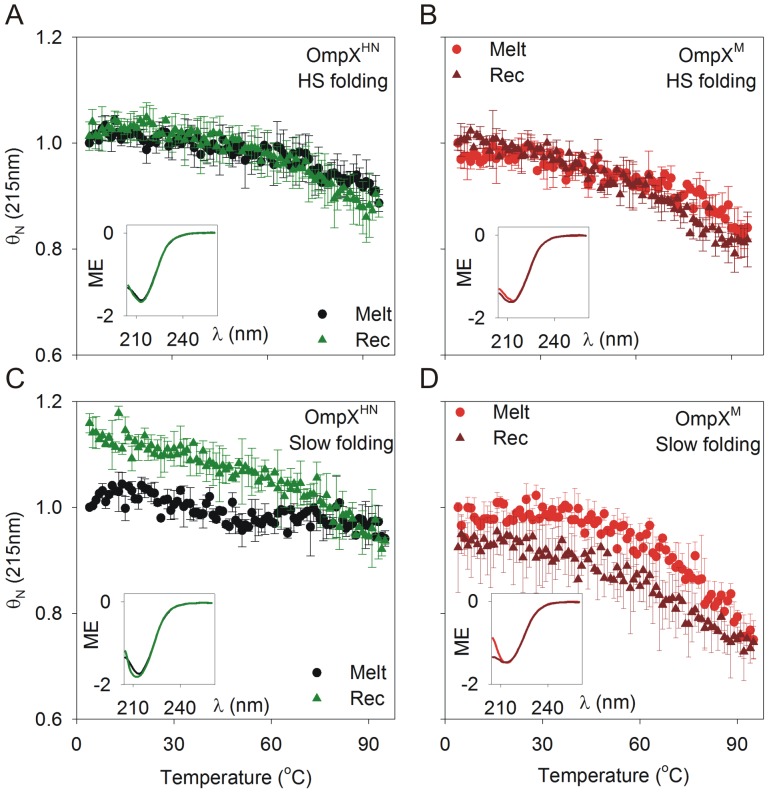
Figure 7. Thermal denaturation (melting) and recovery of OmpXHN and OmpXM monitored using far-UV CD.
Melting (Melt; circle) and recovery (Rec; triangle) of OmpXHN (A) and OmpXM (B), refolded by heat shock (HS folding) in 10 mM LDAO, from 4→95°C and 95→4°C, respectively. (C) and (D) represent data for thermal denaturation and recovery for OmpXHN and OmpXM samples generated by slow folding at 40°C for 3 h (slow folding). All insets represent far-UV CD scans of samples before and after thermal melts. Labels are color coded to match their respective spectra. ME (molar ellipticity) values are in units of deg cm2 dmol−1 and are factored by 106.

