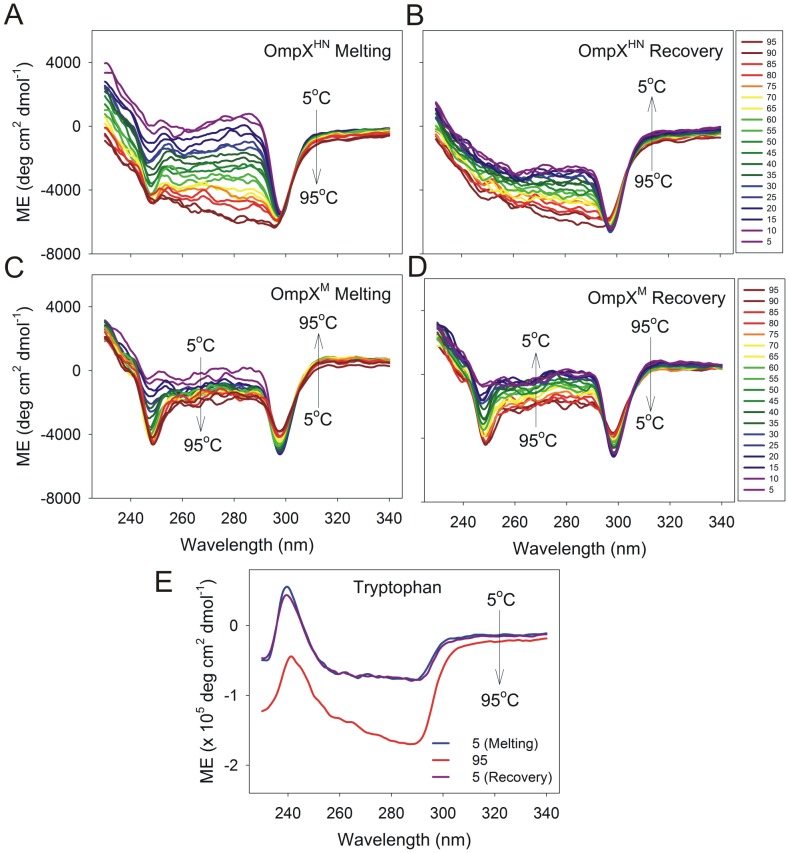
Figure 8. Near-UV CD monitoring spectral changes of heat shock refolded protein with temperature.
OmpXHN and OmpXM exhibit weak near-UV CD spectra that undergo minor variations during thermal denaturation and recovery measurements. Thermal denaturation (A and C) and recovery (B and D) of OmpXHN (A and B) and OmpXM (C and D) are colored based on the temperature gradient, and the direction in which the change occurs is marked in each spectrum. Also shown is the observed spectrum of free tryptophan in 50 mM LDAO (E).

