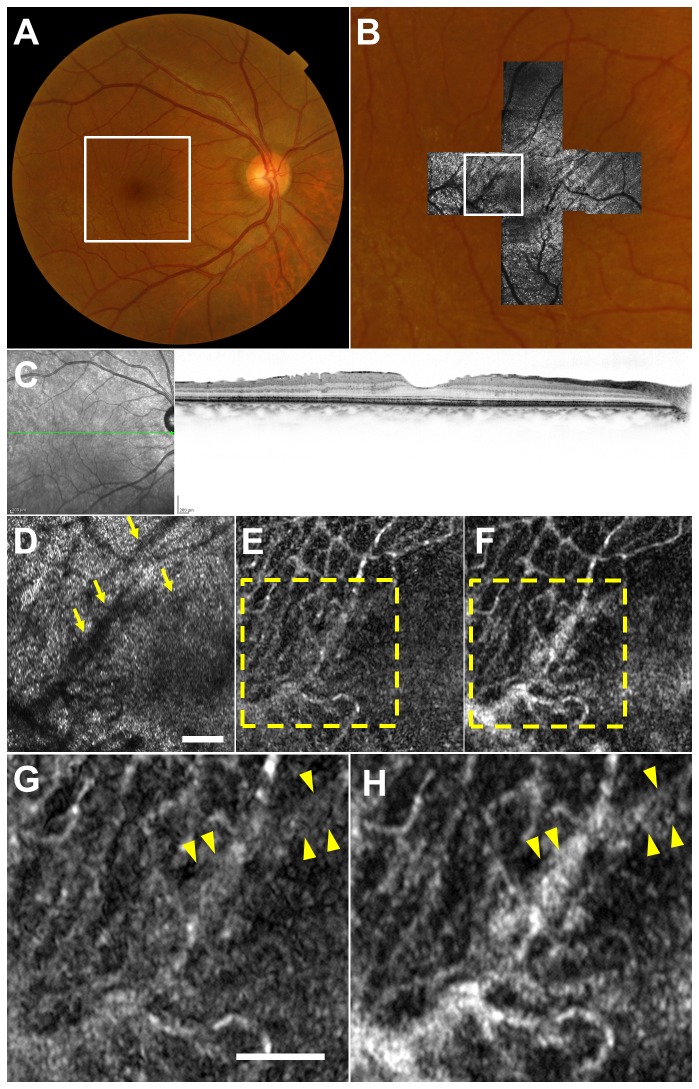
Figure 7. Imaging Results from Case 4.
(A) Color fundus photograph. (B) Montage of adaptive optics scanning laser ophthalmoscopy (AO-SLO) images overlaid on magnified color fundus photograph corresponding to the area outlined in white in (A). (C) The optical coherence tomographic scan shows thin epiretinal membrane and retinal folds. (D) First frame of the AO-SLO video, which corresponds to the area outlined in white in (B), shows "microfolds" (arrows). Scale bar, 100 μm. (E) Capillary image constructed from unregistered AO-SLO video. (F) Capillary image constructed from AO-SLO video after B-spline-based elastic registration. (G, H) Magnified view of the area outlined in yellow in (E) and (F). Scale bar, 100 μm. The capillary image was rather noisy in (G), and visible more clearly in (H). Note that vessel images overlapping with microfolds were obscured by white striped artifacts (arrowheads) in both images.

