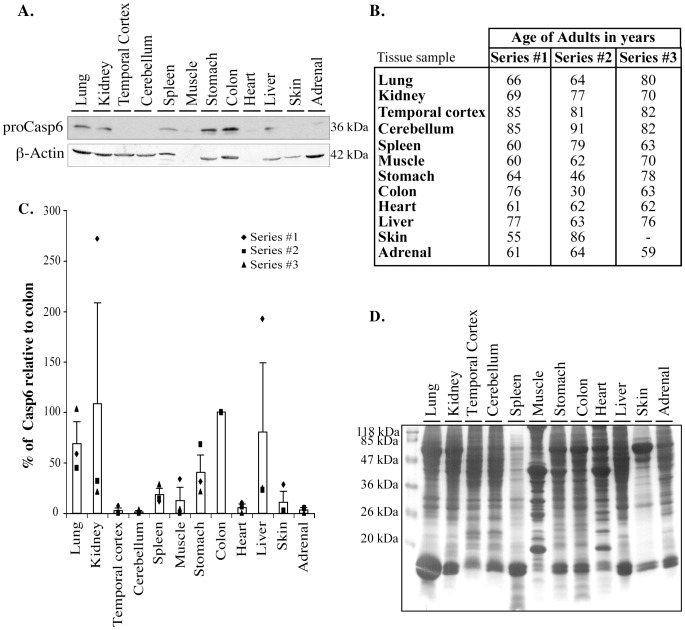
Figure 4. Steady state levels of Casp6, Casp1, and Casp3 in human adult tissues.
A. Representative western blot (series #2) of 100 µg of total proteins from adult tissues with Upstate anti-Casp6 antisera (ProCasp6) and β-Actin antibody. B. Age of adult tissues used for the study. C. Bar graph of the average of proCasp6 levels relative to that in colon arbitrarily placed at 100. Data represent the individual values as well as mean and SEM of 3 independent experiments. D. Coomassie stained gel of proteins from tissues in series 2.

