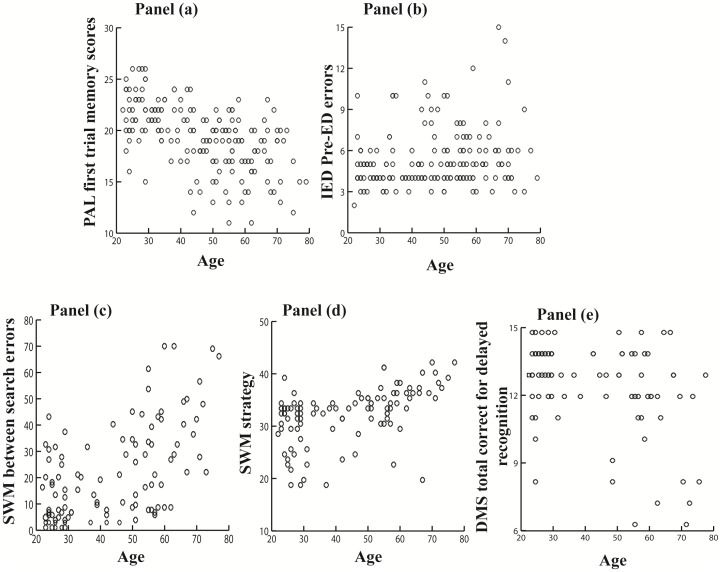
Figure 1. Scatter plots displaying the relation between CANTAB measures and age.
Panel (a) shows the relation between PAL first trial memory scores and age (N = 180). Panel (b) shows the relation between IED Pre-ED errors and age (N = 176). Panel (c) shows the relation between SWM between search error and age (N = 103). Panel (d) shows the relation between SWM strategy and age (N = 103). Panel (e) shows the relation between DMS total correct for delayed recognition and age (N = 85).

