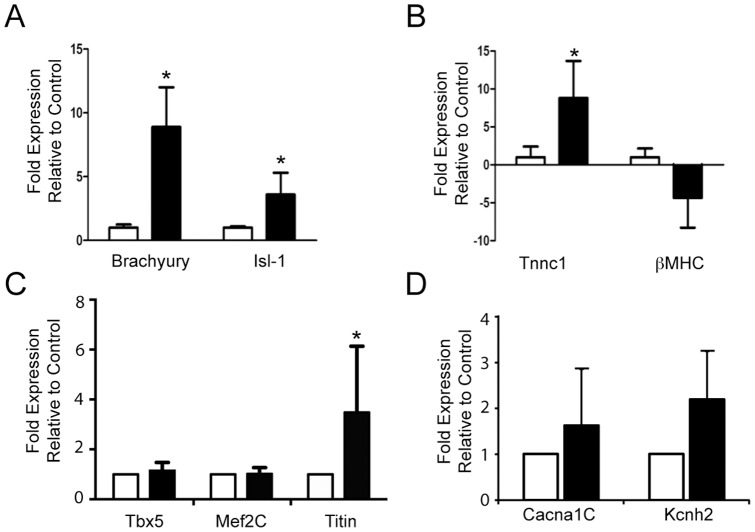
Figure 4. Bar graphs show expression of (A) the mesodermal marker brachury and cardiac progenitor marker Isl-1, (B) differentiation/structural markers for cardiomyocytes, (C) HIF-1alpha target genes Tbx5, Mef2c and titin and (D) ion channels Cacna1c and Kcnh2 upon EB differentiation for 14 days under normoxic (white bars) conditions or following 24 h hypoxia initially followed by normoxia for 13 days (black bars).
(* p<0.05; n = 4, performed in 2 independent experiments).

