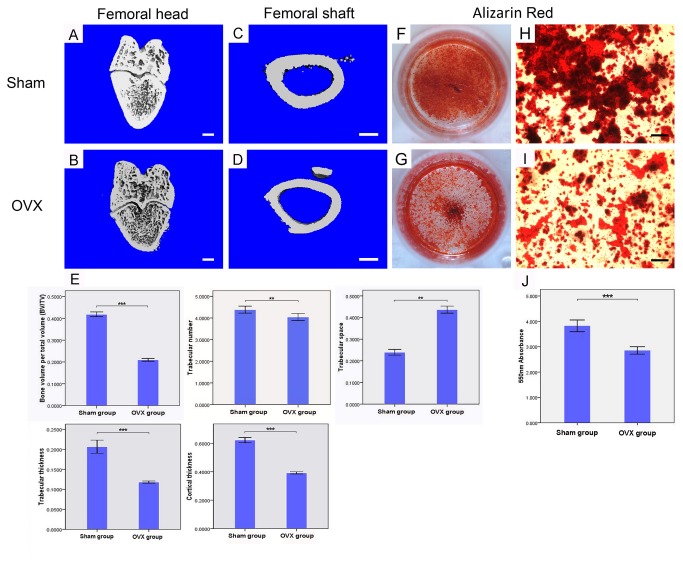
Figure 1. Establishment of OVX model.
3D-μCT images of distal femoral head (A) and femoral shaft (C) in Sham rats; 3D-μCT images of distal femoral head (B) and femoral shaft (D) in OVX rats. Quantitative data of BV/TV, Tb.N (trabecular number), Tb.Sp (trabecular space), Tb.Th (trabecular thickness) in femoral heads and Cor. Th (cortical thickness) in femoral shafts between OVX and Sham rats (n=6 per group). (E; Bar=1mm) Alizarin Red staining for Sham (F,H) and OVX (G,I) rats derived MSCs culture in osteogenic medium at day 28. Quantitative comparision of mineralized nodules between Sham and OVX MSCs (J). Cell assays were performed in triplicate. (Bar=100µm) ** P<0.01, ***P<0.001.

