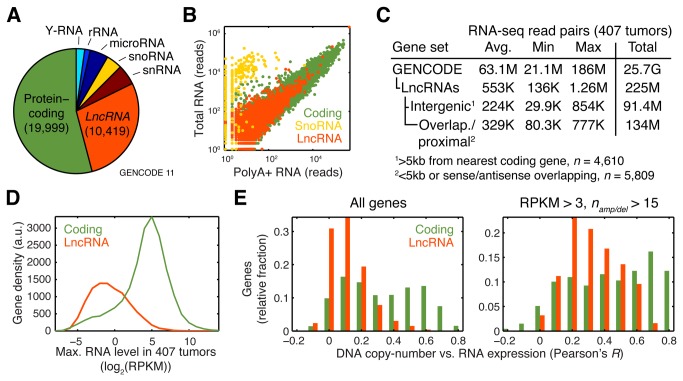
Figure 1. Molecular profiling of lncRNAs in 407 ovarian adenocarcinomas.
A, Relative abundances of gene categories in the GENCODE 11 annotation (unique loci). B, Polyadenylation status of lncRNAs, determined by polyA+ vs. total RNA-seq from a mixture of 16 tissues. C, LncRNA expression profiling using polyA+ RNA-seq across 407 tumors. In total 25.7 billion uniquely mapped read pairs, encompassing >3 terabases, were counted in GENCODE genes. The table shows per-tumor sequencing depth, based on all GENCODE-mapped reads or lncRNA subsets. D, Distributions of lncRNA and coding gene expression levels (maximum RPKM in all tumors). RPKM, reads per kilobase per million reads. E, Histograms of correlations between DNA copy-number and RNA level (based on 407 tumors with dual data). Left panel: lncRNAs overall (left panel, n = 10,066), showing lower correlations compared to coding genes. Right panel: improved correlations when considering genes expressed at RPKM > 3 (top 19% lncRNAs, n = 1920) that were also amplified or deleted in >15 samples (right panel, n = 125).

