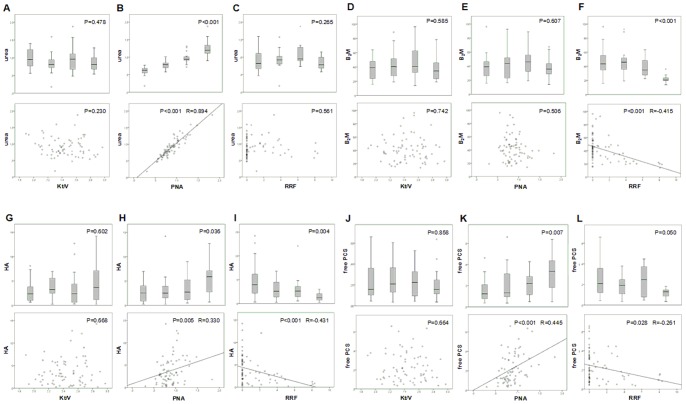
Figure 1. Box plots of quartiles and correlations of different solute concentrations versus Kt/V, PNA, and RRF: urea in g/L (panels A, B, and C), β2M in µg/mL (panels D, E, and F), HA in mg/dL (panels G, H, and I), and free PCS in mg/dL (panels J, K, and L).
β2M: beta-2-microglobulin, HA: hippuric acid, PCS: p-cresylsulfate, PNA: protein equivalent of nitrogen appearance, RRF: residual renal function.

