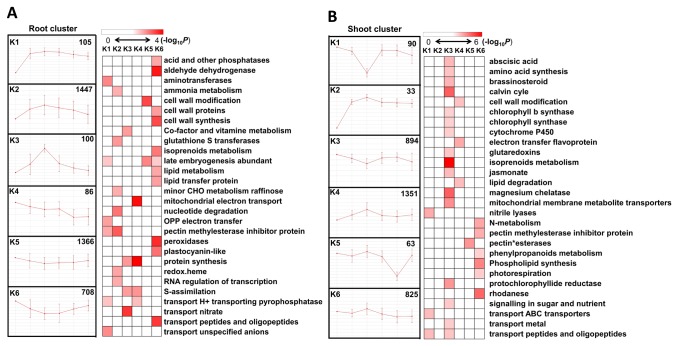
Figure 4. Dynamic changes in the transcriptome of S. europaea revealed by cluster analysis.
DEGs in S. europaea root (A) and shoot (B) were analyzed by k-means cluster analysis followed by functional enrichment analysis for the genes in different clusters, based on the second level of MapMan Bin classification. Fisher’s exact test was used to identify the MapMan Bin overrepresented in each of the cluster when compared with the whole transcriptome background. The P value was converted to -log10 and demonstrated by Heat map viewer. The darker color for the MapMan Bin represented the higher degree of the functional enrichment that appeared.

