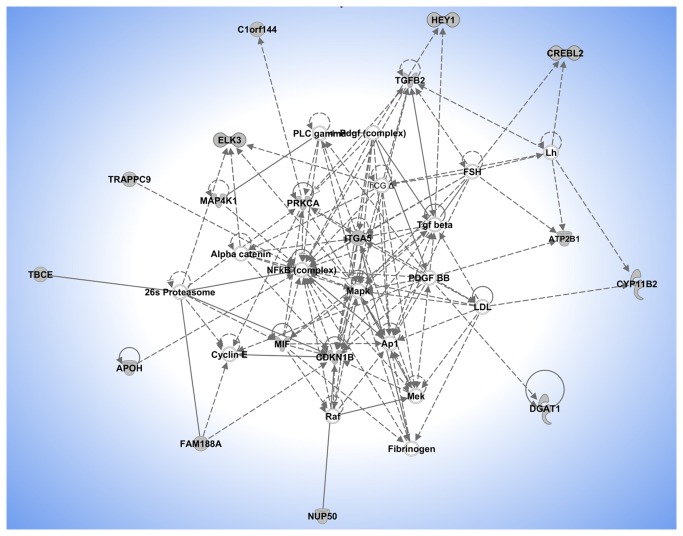
Figure 2. Network 2 generated by the Ingenuity Pathway analysis software.
Genes identified under the main peaks of the genome scan are shown in grey, while the symbols without color are the genes added by Ingenuity Pathway Analysis Software to produce the network (connecting genes). Lines in the network indicate direct interaction, while dotted lines indicate indirect interactions. Nodes are displayed using various shapes that represent the functional class of the gene product. The composite score of the network is 34, that represents the negative log of the p-value for the likelihood that the molecules would be found together by chance. A higher score indicates greater probability that the molecules in the network are interconnected.

