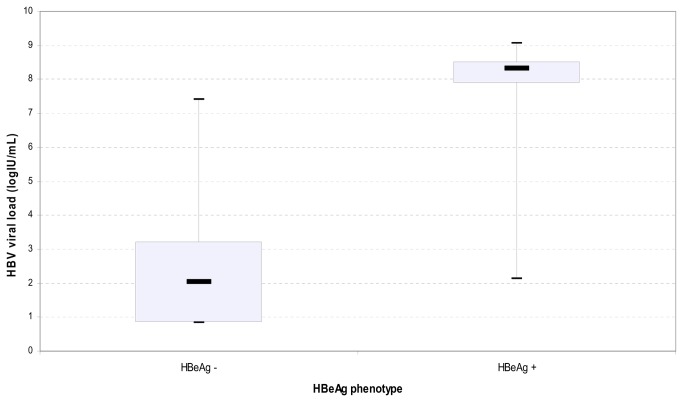
Figure 3. Plots of Log IU/mL HBV-DNA according to the HBe status.
Quantification of HBV DNA using the Abbott Real Time HBV PCR: the median of the log IU/mL HBV viral load (solid black bar in the figure) was significantly higher in HBeAg-positive pregnant women than HBeAg-negative ones (8.33 log IU/mL versus 2.05 log IU/mL respectively).

