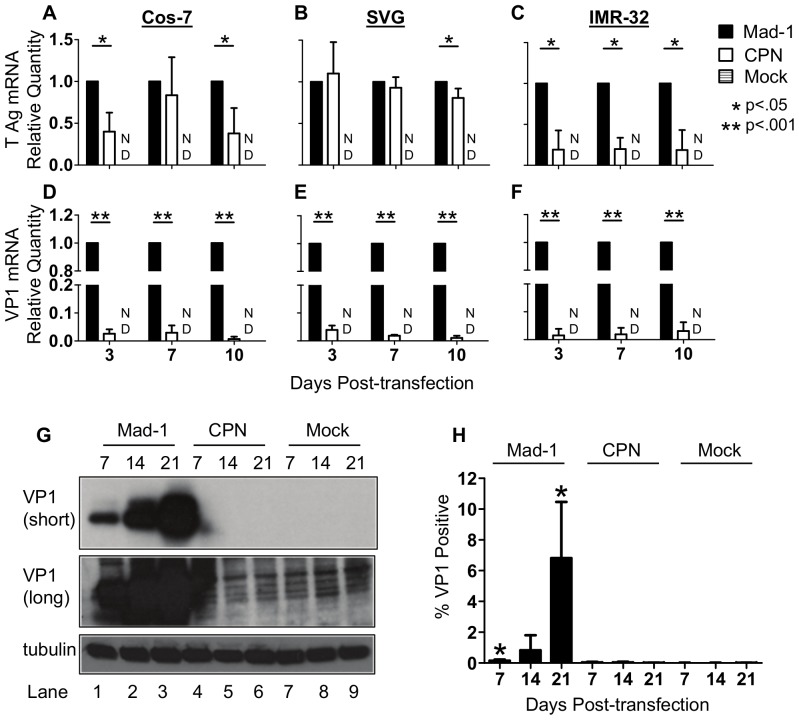
Figure 2. JCVCPN expresses less early and late mRNA and VP1 protein than JCVMad-1.
(A–F) Cos-7, SVG and IMR-32 cells were transfected with JCVMad-1, JCVCPN or mock transfected and samples collected as described in Figure 1. qRT-PCR was used to determine the levels of early (T Ag) and late (VP1) transcripts. Relative Quantity (RQ) was calculated using the ΔΔCt method, using TATA-Box Binding Protein (TBP) as the endogenous control and JCVMad-1 as the calibrator sample. Data represents the average of 5–6 independent experiments. (A and D) In Cos-7 cells, JCVCPN expresses significantly lower levels of T Ag (A) and VP1 (D) mRNA. (B and E) In SVG cells, levels of T Ag (B) mRNA expressed by JCVCPN are similar to JCVMad-1, while VP1 (E) mRNA is significantly lower. (C and F) JCVCPN expresses significantly less T Ag (C) and VP1 (F) mRNA in IMR-32 cells. Error Bars represent standard deviation. P values were calculated for Student's t test using univariate analysis. ND is not detected. (G) Western blots were done with PAB597 (anti-VP1) using cell lysate from Cos-7 cells transfected with either JCVMad-1 (Lanes 1–3), JCVCPN (Lanes 7–9) or mock transfected cells (Lanes 4–6) collected 7 (Lanes1,4,7), 14 (Lanes 2,5,8) or 21 (Lanes 3,6,9) days post-transfection. VP1 can be detected in JCVMad-1 transfected cells at all time points, but not at any time with JCVCPN, with either a short (upper panel) or long (middle panel) exposure. Anti-tubulin antibody was used for loading control (lower panel). Blots are representative of 3 independent experiments (H) JCVMad-1, JCVCPN or mock transfected Cos-7 cells were analyzed for VP1 expression by flow cytometry. JCVMad-1 but not JCVCPN transfected cells have significantly higher levels of VP1 positive cells than Mock transfected samples. Results are the average of 4 independent experiments. Error bars represent standard deviation. P values were calculated using students t test, comparing JCVMad-1 and JCVCPN to mock.

