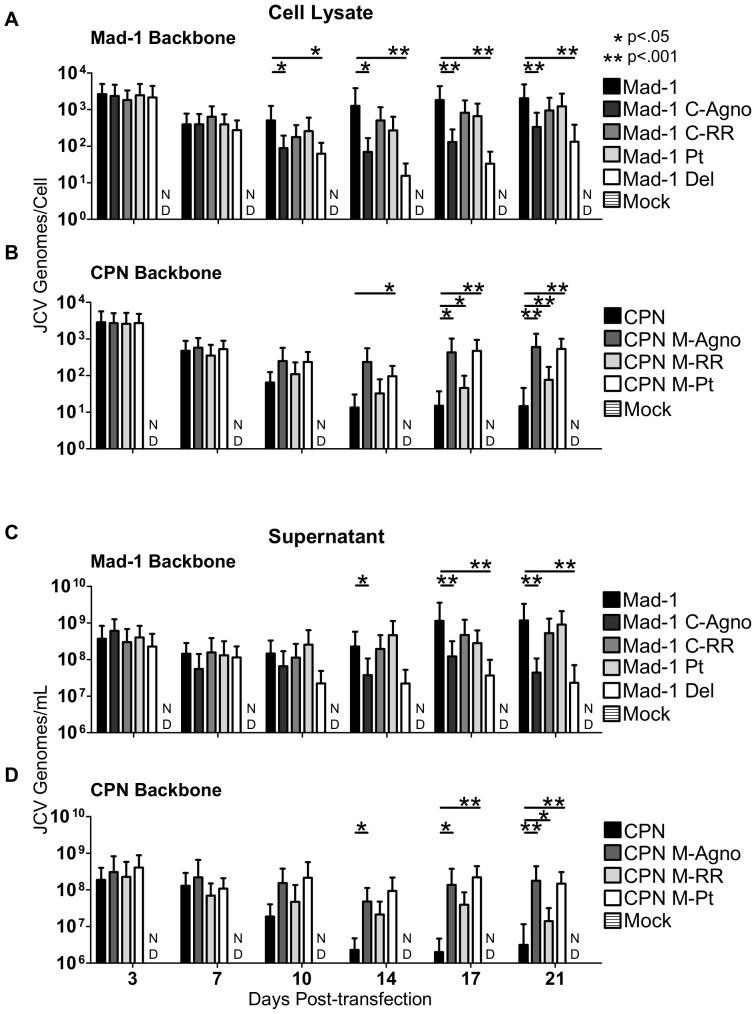
Figure 5. The agnogene deletion of JCVCPN is the primary cause of its replication defect.
Linearized JCV DNA of JCVMad-1, Mad-1 C-Agno, Mad-1 C-RR, Mad-1 Pt, Mad-1 Del, JCVCPN, CPN M-Agno, CPN M-RR, and CPN M-Pt were transfected into Cos-7 cells and DNA levels were quantified over 3 weeks, as described in Figure 1. (A and C) Levels of DNA with JCVMad-1 and the chimeras and agno deletion viruses on the JCVMad-1 backbone were measured in the cell lysate (A) and supernatant (C). Mad-1 C-Agno and Mad-1 Del show significantly lower levels of DNA late in infection. (B and D) Levels of DNA with JCVCPN and the chimeras and agno deletion viruses on the JCVCPN backbone were measured in the cell lysate (B) and supernatant (D). Introduction of a full length agnogene causes the greatest increase in DNA levels. Data represents the average of 4–10 independent experiments. Error bars represent standard deviation. P-values were calculated with the Wilcoxon Rank Test. ND is not detected.

