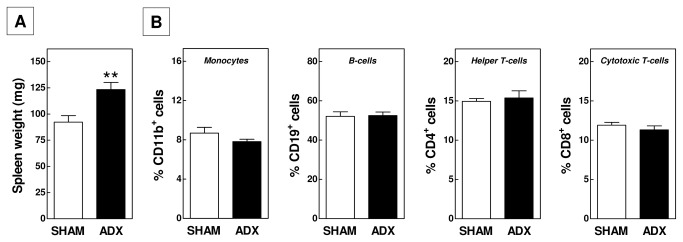
Figure 3. Absolute spleen weights (A) and relative amounts of monocytes, B- and T-lymphocyte populations in spleens (B) of adrenalectomized (ADX) and SHAM-operated APOE knockout mice.

Values represent means+SEM of 5 (FACS data) or 10-15 (spleen weight) mice per group. ** P<0.01.
