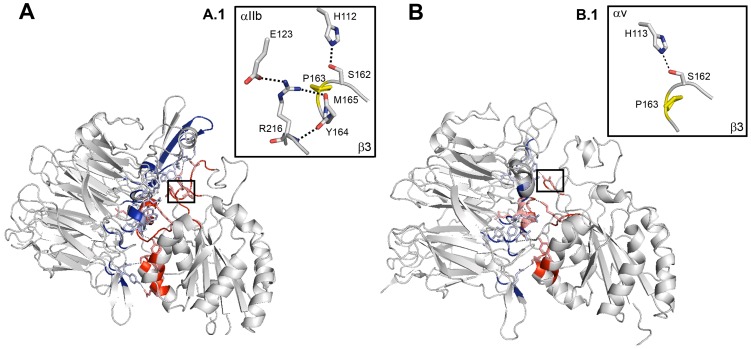
Figure 3. Static modeling showing the positioning of β3P163.
Panel (A) represents computer-drawn ribbon diagrams of the WT αIIb and β3 headpiece complex and panel (B) the corresponding structure for WT αv and β3 subunits. Interacting surfaces are colored in blue for αIIb or αv, and in red for β3. Amino acids forming a H-bond with their counterpart in the other subunit are represented as sticks. H-bonds are shown as dotted lines. Interactions modified by the mutation are highlighted in boxes A.1 and B.1. The mutated proline is colored in yellow. Models were obtained using the PyMol Molecular Graphics System, version 1.3, Schrödinger, LLC and 3fcs and 1u8c pdb files for the crystal structure of αIIb in complex with β3 and αv in complex with β3 in bent conformations.

