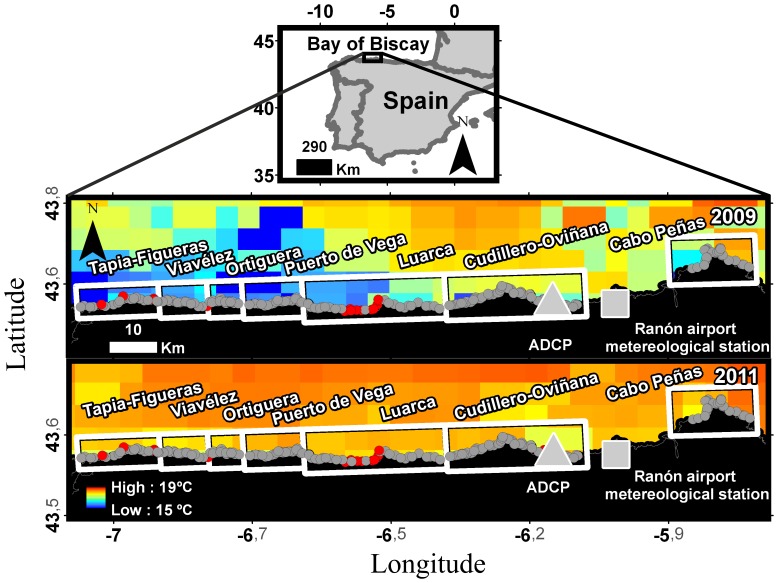
Figure 1. Map of the Asturian gooseneck barnacle management plan.
Frames represent the seven fishers' guilds. Grey dots indicate fishing areas with no bans and red dots areas with a total ban. The light grey square indicates the meteorological station and the light grey triangle the location of the ADCP. Background colors indicate the 2009 (upper map) and 2011 (lower map) Sea Surface Temperature (SST) averaged for the period incorporated in our model (see methods). SST data were obtained from the Terra MODIS satellite at a 4 km resolution.

